Download
1 / 9
90 likes | 90 Views
Discussion on examining the performance of RapidCATCH indicators and comparison of Care Group projects' indicator gap closure with CSHGP average and best performing underweight projects.

E N D
Food Security & Nutrition NetworkSocial & Behavioral Change Task ForceMeeting #2 February 18, 2011
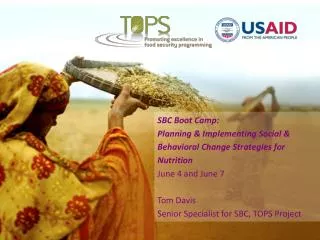
Change and Performance on CS Indicators • There is no dataset with performance on MYAP indicators of all Food Security orgs (pending). • In the meantime, can examine RapidCATCH indicator performance by all child survival projects. • Many R.C. indicators are behavioral, others are involve care seeking (so BC required), one is an impact indicator, and two are knowledge indicators. • Compared performance index on RapidCATCH indicators of 58 projects ending between 2003 and 2009, and nine projects (most from the same period, but one from 2010) using Care Groups. • A Care Group is a group of 10-15 volunteer, community-based health educators who regularly meet together with NGO project staff for training and supervision. • Each of these volunteers then go out at least monthly to do health promotion with a small cohort of mothers of young children. Different from typical “mothers groups” in that each volunteer is responsible for regularly visiting 10-15 of her neighbors, sharing what she has learned and facilitating behavior change at the household level.
RapidCATCH Indicators • Underwt: % of children 0-23m who are underweight. (WAZ<-2) • Birth Spacing: % of children 0-23m who were born at least 24m after the previous surviving child. • Skilled Birth Attendance: % of mothers of children 0-23m whose births were attended by skilled prersonnel. • TT2: % of mothers of children 0-23m who received second dose of tetanus toxoide prior to birth of their young child. • EBF: % of children 0-5m who were exclusively breastfed in last 24 hours. • Comp. Feeding: Percentage of children age 6-9m who received breast milk and complementary foods during the last 24 hours • Full Vaccination: % of children age 12-23m who are fully vaccinated before the first birthday • Measles: Percentage of children age 12-23m who received a measles vaccine • ITN: % of children 0-23m who slept under an ITN (in malaria risk areas) the previous night • Danger signs (knowledge): % of mothers of children 0-23m who know at least two signs of childhood illness that indicate the need for treatment. • IncFluids/Feeding: % of sick children age 0-23m who received increased fluids and continued feeding during an illness in the past two weeks. • AIDS knowledge: % of mothers with children 0-23m who cite at least two known ways of reducing the risk of HIV infection. • HWWS: % of mothers with children 0-23m who report that they wash their hands with soap/ash [4 correct times]
All CSHGP Projects: Indicator Gap Closure Gap closure range ~25 – 45% … projects achieve 25-45% of what is possible. (Avg. = 37%)
Indicator Gap Closure: Care Group Projects vs. CSHGP Average Gap closure range for Care Group projects: ~35 – 70% (Avg = 57%)
Indicator Gap Closure: Care Group Projects vs. CSHGP Average vs. Best Performing Underwt Projects