Download
1 / 21
210 likes | 335 Views
Valuation 10: Ecological Footprints. The critique The alternative Critique on the alternative Avoidance costs. Last weeks we looked at. The neo-classical approach to the monetary valuation of environmental goods and services that are not traded on the market

E N D
Valuation 10:Ecological Footprints • The critique • The alternative • Critique on the alternative • Avoidance costs
Last weeks we looked at • The neo-classical approach to the monetary valuation of environmental goods and services that are not traded on the market • We will look at two alternatives (ecological footprints; avoidance costs) • The second is ducking the issue, the first challenges economic theory
The Critique • The neo-classical theory of value is built on two premises: • Supply versus demand; or relative scarcity • Human preferences; or what people want • The implications are, of course, that absolute scarcity is irrelevant, as long as people do not care – and that, if it does not matter to people, it does not matter • There are, of course, also operational objections, and misinterpretations
The Critique -2 • Nordhaus once said: As agriculture has a share of only 3% of GDP, the impact of climate change on agriculture in unlike to exceed 3% of GDP • Obviously, prices are a linear approximation around the current situation, and should only be used to evaluate relatively small policy interventions • Of course, policy is always tinkering at the margin
The Critique -3 • Wackernagel and Rees raise the interesting point that if a resource stock falls, its price will increase, so that the total value stays the same, so that nothing is the matter apparently • The math apart, W&R clearly confuse stocks and flows – if a resource price rises, further degradation is valued more, not less
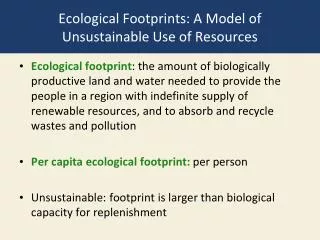
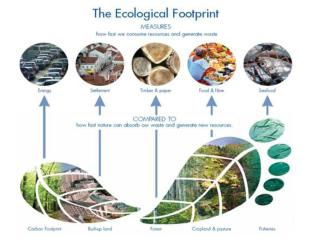
The Alternative • So, what do W&R propose to do instead? • The Ecological Footprint! • Since its inception in 1995, the EF has become tremendously popular, partly because of the energy of W&R and partly because it is a really simple indicator • There a number of similar indices that are less popular but try do the same thing, that is, derive a superindicator measured in physical terms
Il Orma Ecologica • 57 mln Italians drink some 15 mln tonnes of milk per year; an hectare yields some 500 kg milk, so that‘s 0.5 ha/cap • They eat 26 mln tonnes of cereals, for which they need 0.2 ha/cap – the energy this takes comes later, the pesticides and nutrients are omitted • They eat about 5 mln tonne of meat per year; this takes 0.8 ha/cap – this is not just an average over space, but also over time – what about eating diary cows?
Il Orma Ecologica -2 • 57 mln Italians use 29 mln tonne of timber, 26 of which is imported – with 2 kg/ha, this take 0.25 ha/cap • Wool .3 mln tonne, 15 kg/ha, so 0.3 ha/cap • (Note that math is really not their strongest point) • Italians consume 12 GJ of coal; absorbing the emitted carbon at 55 GJ/ha would take 0.2 ha/cap • Finally, Italians have about 0.1 ha/cap of build-up area
Il Orma Ecologica -3 • So, now we have ha/cap for agriculture, forestry, energy and living • We cannot just add these up, because agricultural land is biologically more productive than are forests (never mind that this is because of human disturbance and fertilizers) • Multiplying space with the appropriate indicators, Italians use 4.2 ha/cap • But, they have only 1.3 ha/cap!
Il Orma Ecologica -4 • Italians use 4.2 ha/cap • But, they have only 1.3 ha/cap! • Note that the ecological footprint implicitly condemns international trade – it states that Italy uses 3 times its allocated space, which is possible only because Italy forcibly uses other countries‘ room • This point becomes even more pugnant if one calculates the EF for cities; e.g., London‘s footprint is 200 times the size of the city
Ecological Footprint • World consumption takes up about 2.8 ha/cap, whereas the world has only 2.1 ha/cap available • This is only possible because we are using up fossil resources – which is true for energy, soil and water • This is a recipe for disaster, unless one considers that resource stock are being replaced with capital and knowledge stocks
Tol‘s Footprint • My footprint is about 20.4 (34.5) hectare – if everyone were to live like me, we would need 11.3 (19.1) Earths • Although I am a vegetarian and generate little waste, I do live in a big house far away, commuting by car; I also fly a lot • See the test on http://www.earthday.net/footprint.stm • This test may surprise you, shock you, or make you think, please remain calm ... But not too calm!!
Critique • The used weights are presumably physical and ecological – and therefore have little relation to social or political priorities – this may reflect a higher truth, but is not handy for a decision analytic tool • What to make of an assessment that praises Iceland and Indonesia, while condemning Bangladesh and Singapore? • Part of this comes from using world average productivity figures
Critique -2 • Why are crop land and roads equally productive? • Why are all forests equal, regardless of how they are managed? • A large share of the ecological footprint is energy use – which is converted to land by absorbing carbon in tree plantations – why not biomass energy, or solar power? – both would lead to substantially lower numbers
Critique -3 • Ecological footprints are as arbitrary as the region to which they are applied • Computing an EF for a locality implicitly condemns trade – and the good things that trade does for the economy and the environment • Most problematic, however, the EF has an absolute measure of value – much like the classical labour theory of value
Critique -4 • Most problematic, however, the EF has an absolute measure of value – much like the classical labour theory of value • The labour theory of value found its grave, in theory as well as in practice • Absolute value theories may work as long as the anchor is indeed dominant, but get increasingly complex if that is no longer the case • Whether land dominates at present is, at best, questionable
The Use of Valuation • Valuation serves three purposes • First, we want to determine the optimal level of policy intervention • Second, we want to value the total amount of environmental pollution and degradation, e.g., for inclusion in the national accounts • Third, we want to calculate the compensation polluters need to pay to victims • Some require marginal costs, others consumer surpluses (well, CV or EV)
Avoidance Costs • The avoidance cost method turns the first purpose – optimal policy – on its head • We know the (marginal) costs of emission reduction • We assume that the actual policy intervention is optimal • Therefore, we know the marginal benefit of the optimal policy • But, obviously, not the welfare change
Avoidance Costs -2 • With a marginal benefit point estimate, we can meet the second and third purpose of valuation (national accounts, compensation) • But, not the first (optimal policy) – the implicit assumption is that, even though the valuation specialist is incapable of estimating the marginal benefit curve, the policy maker is able to, although apparently unable to express this
Avoidance Costs -3 • Note the difference with travel costs and hedonic pricing • In both methods, we assume that the consumer makes a trade-off between environmental amenities and marketed goods – and optimizes that trade-off • However, we look at many consumers, so that we not only can estimate the marginal price curve but also average out randomness and errors • Avoidance costs is based on one decision