Download
1 / 23
230 likes | 365 Views
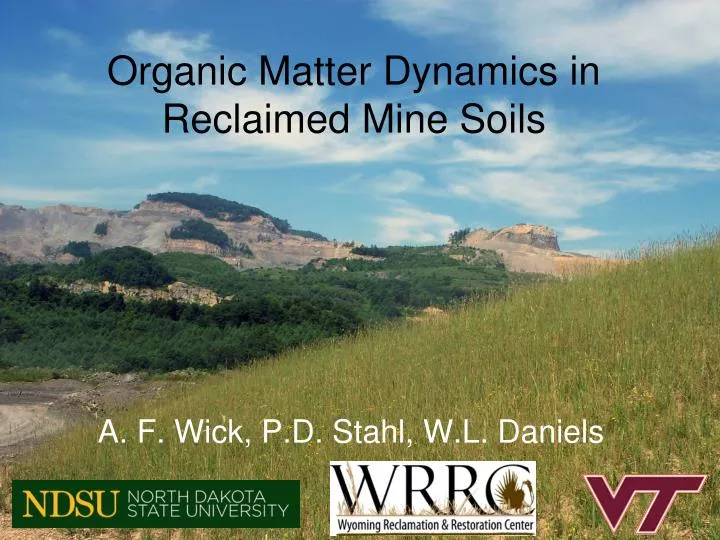
Organic Matter Dynamics in Reclaimed Mine Soils. A. F. Wick, P.D. Stahl, W.L. Daniels. Mining Disturbances. Appalachian: 390,217,000 short tons coal produced (33% of total production in US for 2008) Western: 633,597,000 short tons coal produced (54% of total production in US for 2008).

E N D
Organic Matter Dynamics in Reclaimed Mine Soils A. F. Wick, P.D. Stahl, W.L. Daniels
Mining Disturbances • Appalachian: • 390,217,000 short tons coal produced (33% of total production in US for 2008) • Western: • 633,597,000 short tons coal produced (54% of total production in US for 2008)
Southwest Virginia Mine, view from 30,000’ -post mining: forest
Northeast Wyoming Mine, view from 30,000’ -post mining: wildlife areas, grazing
Differences in Reclamation • East • Amendments/handling crushed rock • High precipitation (~120 cm) • Tree establishment desirable • 5 yr bond release • West • Topsoil salvaged (stockpile or direct haul) • Low precipitation (<55 cm) • Shrub and grass establishment • 10 yr bond release
Though mining and reclamation practices are very different in each region, there is still the potential to accumulate and store C in reclaimed soils What are the accumulation rates?
Carbon Accumulation Rates • Shrestha and Lal, 2006 • 0.31 – 3.1 Mg ha-1 yr-1 (0-30 cm) in grasslands (OH) • 0.58 – 4.0 Mg ha-1 yr-1 (0-30 cm) in forest • Benfeldt et al., 2001 • 0.43 Mg ha-1 yr-1 (0-10 cm) in grasslands (VA) • Schafer et al., 1980 • 1.33 Mg ha-1 yr-1 (0-200 cm) in soils <10 yr old (MT) • 0.45 Mg ha-1 yr-1 (0-200 cm) in soils >10 yr old • Anderson et al., 2008 • 1.17 Mg ha-1 yr-1 (0-30 cm) in grass/shrub mix (WY)
Land Use 1 Pre-mining Land Use 2 Land Use 3 Soil Carbon Climate Soil Structure Soil Function Plant Community Relative Amount of C at t0 Time Since Disturbance
East: <2 yr East: Native
Loss of C with Disturbance-East This loss is for the 0-5 cm depth 0.31 Mg ha-1 yr-1: 170 yrs 3.1 Mg ha-1 yr-1: 17 yrs (Wick and Daniels, 2009, BLRS proceedings)
West: 1 yr West: native
Loss of C with Disturbance-West This loss is for the 0-5 cm depth 0.31 Mg ha-1 yr-1: 147 yrs 3.1 Mg ha-1 yr-1: 15 yrs 1.17 Mg ha-1 yr-1: 39 yrs (Wick et al., 2009, Soil Use Mgt 25: 311-319)
Physical Separation of Active OM <1 year reclamation Native Site
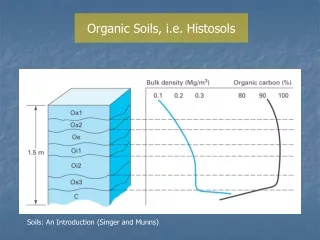
Location of OM • Active • Living or newly added biomass • <10-20% of total OM • 10’s of years • Slow • Physically protected (aggregates) • Important source for nitrogen • 100’s of years • Passive • Very stable, chemically altered and bound (humus) • 60-90% of total OM • 1000’s of years
Eastern Soil Carbon Accumulation Rates Plant Inputs Whole soil: 0.30 Mg ha-1 yr-1 • Active: 0.11 • Slow: 0.10 • Passive: 0.09 194 yrs to reach “native” in 0-5 cm Coarse Textured, 27 yr reclaimed site Active 3.16 Mg ha-1 Slow 2.99 Mg ha-1 Passive 2.82 Mg ha-1
Eastern Carbon Concentrations Bars represent one standard error from the mean Asterisks indicate significantly higher values among soil ages (P<0.05)
Western Soil Carbon Accumulation Rates Plant Inputs Whole soil: 0.17 Mg ha-1 yr-1 • Active: 0.03 • Protected: 0.14 462 yrs to reach “native” in 0-5 cm Coarse Textured Soil, 16 yr reclaimed site Active 3.58 Mg ha-1 Protected (slow+passive) 2.23 Mg ha-1
Western Soil Carbon Accumulation Rates Plant Inputs Whole soil: 0.71 Mg ha-1 yr-1 • Active: 0.55 • Protected: 0.16 86 yrs to reach “native” in 0-5 cm Fine Textured Soil, 26 yr reclaimed site Active 16.09 Mg ha-1 Protected (slow+passive) 6.84 Mg ha-1
Conclusions • EAST: active pool contained 35% total C • WEST: active pool contained 60-70% total C
Conclusions • EAST: Physical protection by aggregates and chemical binding of C to soil particles • WEST: Climatic conditions and soil texture
Questions Abbey Wick (abbey.wick@ndsu.edu) Acknowledgements: Powell River Project WY AML Program Whitney Nash Vicki Regula Lachy Ingram Laurel Vicklund (Belle Ayr Mine) Chet Skilbred (Dave Johnston Mine) Danny Early (Red River Coal) Julie Burger Susanna Gomez Amy Baker