Download
1 / 41
410 likes | 510 Views
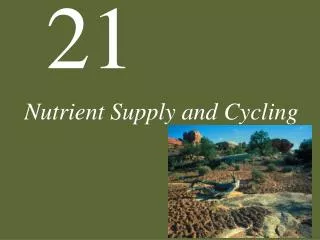
Summary of results from the Regional Forest Nutrition Research Project and Stand Management Cooperative Rob Harrison, Dave Briggs, Eric Turnblom, Bob Gonyea, Bert Hasselberg. University of Washington. NUTSUPDM. Nutrient Supply and Use. POTENTIAL USE. SOIL SUPPLY. ACTUAL USE. REMOBILIZED.

E N D
Summary of results from the Regional Forest Nutrition Research Project and Stand Management Cooperative Rob Harrison, Dave Briggs, Eric Turnblom, Bob Gonyea, Bert Hasselberg. University of Washington.
NUTSUPDM Nutrient Supply and Use POTENTIAL USE SOILSUPPLY ACTUAL USE REMOBILIZED UPTAKE FROM SOIL
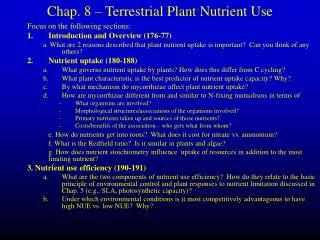
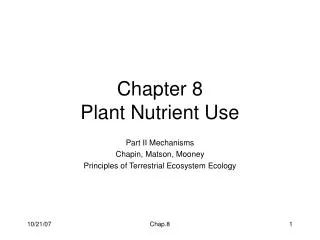
Results: Pre-RFNRP 1950’s through 1960’s
N200 N300 Percent volume response N200-P88-S154 N200-P88-S168+ N100 N52-P12-K220 N rate (lb N/acre)
N+P N200-P88-S168+ N200-P88-S154 N100 N100 N300 N200 Percent volume response N52-P12-K220 N52-P12-K220 N rate (lb N/acre)
N200-P88-S168+ N200-P88-S154 N100 N100 N300 N200 Percent volume response N52-P12-K220 N52-P12-K220 N rate (lb N/acre)
Results of other studies Hodge-podge of nutrients other than nitrogen makes conclusions difficult. Several studies indicate results similar to the 2nd above, and many indicate the central role of N. Clearly, both response to N and other nutrients is site controlled. Indicates need for larger scale studies on a wide variety of sites to pin response to site variables.
Conclusions of early studies “Nitrogen application evoked a growth response throughout a range of growing conditions. Magnitude of response is related to amount of nitrogen applied and response is still evident in 1975 from a 1962 application”. “Apparent response to the application of other elements is quite variable and no consistent picture emerges. There is no evidence of an economic response to the other elements”.
RFNRP 1969-pres.
Installations of the PNW Stand Management Cooperative
(1) Overall results of SMC studies Response vs. N rate. Sidell thesis.
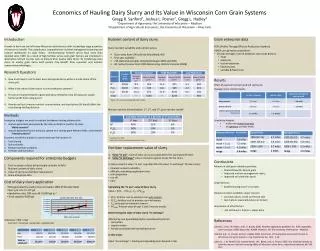
Table 2. Pilchuck Tree Farm study established 1994, measured through 2002 (8 y growth). Each treatment is replicated 6 times (two each installation).
Table 1. Oregon Dept. Forestry study established 1995, measured through 1999 (4 y growth). Each treatment is replicated 6 times (two each installation).
Results of RFNRP studies N response averaging 20% (unthinned) -30% (thinned) with 400 kg N, highly site dependent. Clearly, both response to N and other nutrients is site controlled. Indicates need for larger scale studies on a wide variety of sites to pin response to site variables. Effects of N fertilization appear to be very long-lived.
SMC (1991+) No multi-element additions. SMC Type II, III and IV no fertilizer work at all
SMC Type I Installations • plantations with initial stocking 300-680 spa • Respace (PCT) before onset of competition • 7 core treatments (basic 7) • ISPHa, ISPHa/2, ISPHa/4, • ISPHa and ISPHa/2 min thin • ISPHa repeated thin • ISPHa heavy thin • 2-8 plots for other work, including fertilization • Eric Sucre did his M.S. on 7 fertilized sites
Soil & Site Properties Examined • Climatic data • Elevation • % Slope • Relative Density (RD) • Quadratic Mean Diameter (QMD) • Site Index (SI) • bulk density (Db) • pH • C:N ratio • cation exchange capacity (CEC)* • Inorganic nitrogen (NO3- and NH4+)* *Mineral Soil only
Total volume and 4-year PAI relative response for each treatment regime at the respected treatment intervals (224 kg ha-1 of N as urea every 4 years). Standard errors are shown.
Multiple regression equations for the relationships between the unstandardized residuals of total volume (m3 ha-1) and 4-year PAI (m3 ha-1 yr-1) response to 224 kg N ha-1 as urea (dependent variables) and various soil, site and stand variables (independent variables).
Results of SMC studies too few sites (7) for broad generalizations Response to N is site and stand controlled. Indicates need to couple fertilization with other silvicultural treatments, particularly stocking, and use RD or other stand properties to drive time of fertilization.