Download
1 / 20
200 likes | 337 Views
Designing Experiments. Scientific Method Parts of the Scientific Method The Hypothesis The Experiment Independent and Dependent Variables Sampling Paradigms. Scientific Method.

E N D
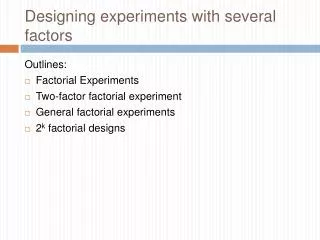
Designing Experiments • Scientific Method • Parts of the Scientific Method • The Hypothesis • The Experiment • Independent and Dependent Variables • Sampling • Paradigms
Scientific Method The scientific method is the process by which scientists, collectively and over time, endeavor to construct an accurate (that is, reliable, consistent and non-arbitrary) representation of the world. http://teacher.pas.rochester.edu/phy_labs/AppendixE/AppendixE.html
Scientific Method The scientific method provides a cogent means of obtaining information that can be used as a solid foundation for supporting instructional decisions (Magill, 1993)
Parts of the Scientific Method • Observation and description of a phenomenon or group of phenomena. • Formulation of an hypothesis to explain the phenomena. • Use of the hypothesis to predict the existence of other phenomena, or to predict quantitatively the results of new observations. • Performance of experimental tests of the predictions by several independent experimenters and properly performed experiments.
Phenomena or Observations of Interest Statement of Problem Specify Hypothesis Conduct Experiment Evaluate Hypothesis Reject Disseminate Knowledge Fail to Reject
Importance of the Research Method: An example from Phrenology and Localization of Function Sir Francis Gall (1800’s)
Hypothesis Tentative causal statement about the relations among factors involved in the occurrence of the phenomenon of interest Proctor & van Zandt (1994)
Stimulus or Input Movement or Output Influence of Observation on subsequent Motor Performance: PREDICTION
B, C, or D A IMM 24hr
Figure 3. Mean Speed for Task A for no interference (open circles) and interference conditions (closed circles) on the leftmost plot. The central panel shows Task B performance for the interference condition performed 2-hrs after Task A practice. Mean Speed for Task B is similar to that observed for the initial practice of Task A. The rightmost plot reveals Task A performance for the 24-delayed test for interference and no-interference conditions. Note the speed enhancement that is present at test for the no interference condition (distance of open circle from dash line). This benefit is reduced considerably by introducing interfering practice shortly after initial task practice [1,2] (see also Figure 4 on the right).
Figure 4. Mean speed for the last three trials of practice (black bars) and for the three test trials (white bars) are displayed for the no interference (A) and interference (B) conditions. This procedure has been used elsewhere to indicate offline learning [1]. Offline learning is present in both A and B but is significantly greater when interference was not experienced (A). These data are compared to the smaller additional improvement revealed when individuals merely continued practicing for 3 additional 30s trials (~3%) with no break beyond the 30 s rest afforded between all other practice trials (Data taken from Wright et al. [4](C)). D E F Figure 5. Mean speed for the last three trials of practice (black bars) and for the three test trials (white bars) are displayed for each exercise condition: IMM (D), MID (E), and END (F). Offline line learning is present in all cases but experiencing exercise just prior to the interfering material (END) resulted in offline learning most similar to the no interference conditions (A). It appears then that the introduction of exercise did lead to the return of offline learning despite exposure to interfering practice.
TIME 0 hr 1 hr 2 hr 22 hr
Testing Your Prediction: The Experiment includes the manipulation of an independent variable and an examination of its (i.e., the IV) effect on a dependent variable. • The measured variable is called the Dependent Variable • (e.g., speed or accuracy) • The manipulated variable is called the Independent Variable • (e.g., Exercise vs. No Exercise; exercise modality)
Figure 4. Mean speed for the last three trials of practice (black bars) and for the three test trials (white bars) are displayed for the no interference (A) and interference (B) conditions. This procedure has been used elsewhere to indicate offline learning [1]. Offline learning is present in both A and B but is significantly greater when interference was not experienced (A). These data are compared to the smaller additional improvement revealed when individuals merely continued practicing for 3 additional 30s trials (~3%) with no break beyond the 30 s rest afforded between all other practice trials (Data taken from Wright et al. [4](C)). D E F Figure 5. Mean speed for the last three trials of practice (black bars) and for the three test trials (white bars) are displayed for each exercise condition: IMM (D), MID (E), and END (F). Offline line learning is present in all cases but experiencing exercise just prior to the interfering material (END) resulted in offline learning most similar to the no interference conditions (A). It appears then that the introduction of exercise did lead to the return of offline learning despite exposure to interfering practice.
Sampling for the Experiment • A subject population is comprised of all persons (in the world) who meet a certain set of conditions. • A sample is a subset of the entire population. The experimenter attempts to use a sample that is representative of the entire population since normally an entire population can not be tested. • Randomization is used to increase the probability of the sample being truly representative of the population.
Transfer Paradigm important for assessing “relative permanence” of information or what we might commonly refer to as learning • Training Periods which involves manipulation • adequate retention interval • test on common level of the independent variable
Tests • Retention • Tests that assess the permanance of knowledge acquired during practice (e.g., free recall) • Transfer • Tests that assess the generalizability of knowledge acquired during practice (e.g., tests for effector independence
Verwey & Wright (2004) (Random.. X2) (4-1-3-2-4-3….X12) (Random.. X2) (4-1-3-2-4-3….X12) (Random.. X2) (3-2-1-4-3-4….X12) (Random.. X2) (4-1-3-2-4-3….X12) (Random.. X2) (3-2-1-4-3-4….X12)
The Bigger Picture Spatial Locations Temporal Uncertainty Spatial Uncertainty Adapted from Janata & Grafton (2003)
What Next? • Quantifying Behavioral Outcome • Accuracy • Latency • Kinematics • Kinetics • Neural Contributions to Behavior • Imaging • EMG