Download
1 / 1
10 likes | 153 Views
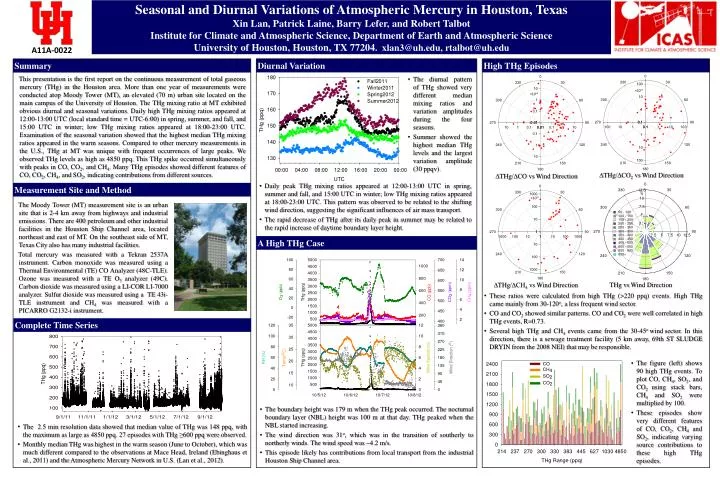
Seasonal and Diurnal Variations of Atmospheric Mercury in Houston, Texas Xin Lan, Patrick Laine, Barry Lefer, and Robert Talbot Institute for Climate and Atmospheric Science, Department of Earth and Atmospheric Science University of Houston, Houston, TX 77204 . xlan3@uh.edu, rtalbot@uh.edu.

E N D
Seasonal and Diurnal Variations of Atmospheric Mercury in Houston, TexasXin Lan, Patrick Laine, Barry Lefer, and Robert TalbotInstitute for Climate and Atmospheric Science, Department of Earth and Atmospheric ScienceUniversity of Houston, Houston, TX 77204. xlan3@uh.edu, rtalbot@uh.edu A11A-0022 ×10-9 These ratios were calculated from high THg (>220 ppq) events. High THg came mainly from 30-120o, a less frequent wind sector. CO and CO2 showed similar patterns. CO and CO2 were well correlated in high THg events, R=0.73. Several high THg and CH4 events came from the 30-45o windsector. In this direction, there is a sewage treatment facility (5 km away, 69th ST SLUDGE DRYIN from the 2008 NEI) that may be responsible. This presentation is the first report on the continuous measurement of total gaseous mercury (THg) in the Houston area. More than one year of measurements were conducted atop Moody Tower (MT), an elevated (70 m) urban site located on the main campus of the University of Houston. The THg mixing ratio at MT exhibited obvious diurnal and seasonal variations. Daily high THg mixing ratios appeared at 12:00-13:00 UTC (local standard time = UTC-6:00) in spring, summer, and fall, and 15:00 UTC in winter; low THg mixing ratios appeared at 18:00-23:00 UTC. Examination of the seasonal variation showed that the highest median THg mixing ratios appeared in the warm seasons. Compared to other mercury measurements in the U.S., THg at MT was unique with frequent occurrences of large peaks. We observed THg levels as high as 4850 ppq. This THg spike occurred simultaneously with peaks in CO, CO2,and CH4. Many THg episodes showed different features of CO, CO2, CH4, and SO2, indicating contributions from different sources. Summary The Moody Tower (MT) measurement site is an urban site that is 2-4 km away from highways and industrial emissions. There are 400 petroleum and other industrial facilities in the Houston Ship Channel area, located northeast and east of MT. On the southeast side of MT, Texas City also has many industrial facilities. Total mercury was measured with a Tekran 2537A instrument. Carbon monoxide was measured using a Thermal Environmental (TE) CO Analyzer (48C-TLE). Ozone was measured with a TE O3 analyzer (49C). Carbon dioxide was measured using a LI-COR LI-7000 analyzer. Sulfur dioxide was measured using a TE 43i-TLE instrument and CH4 was measured with a PICARRO G2132-i instrument. Daily peak THg mixing ratios appeared at 12:00-13:00 UTC in spring, summer and fall, and 15:00 UTC in winter; low THg mixing ratios appeared at 18:00-23:00 UTC. This pattern was observed to be related to the shifting wind direction, suggesting the significant influences of air mass transport. The rapid decrease of THg after its daily peak in summer may be related to the rapid increase of daytime boundary layer height. Diurnal Variation Measurement Site and Method The figure (left) shows 90 high THg events. To plot CO, CH4, SO2, and CO2 using stack bars, CH4 and SO2 were multiplied by 100. These episodes show very different features of CO, CO2, CH4 and SO2, indicating varying source contributions to these high THg episodes. Complete Time Series A High THg Case The 2.5 min resolution data showed that median value of THg was 148 ppq, with the maximum as large as 4850 ppq. 27 episodes with THg ≥600 ppq were observed. Monthly median THg was highest in the warm season (June to October), which was much different compared to the observations at Mace Head, Ireland (Ebinghaus et al., 2011) and the Atmospheric Mercury Network in U.S. (Lan et al., 2012). The boundary height was 179 m when the THg peak occurred. The nocturnal boundary layer (NBL) height was 100 m at that day. THg peaked when the NBL started increasing. The wind direction was 31o, which was in the transition of southerly to northerly winds. The wind speed was ~4.2 m/s. This episode likely has contributions from local transport from the industrial Houston Ship Channel area. The diurnal pattern of THg showed very different median mixing ratios and variation amplitudes during the four seasons. Summer showed the highest median THg levels and the largest variation amplitude (30 ppqv). High THg Episodes ×10-6 ∆THg/∆CO2vs Wind Direction ∆THg/∆CO vs Wind Direction % ×10-9 THgvs Wind Direction ∆THg/∆CH4vs Wind Direction 1111111111111