Download
1 / 35
350 likes | 465 Views
Spread of HIV-1 Infection. Formation of Clades Rec0mbinant Strains Differential rates of evolution Novel strategies for development of vaccines and therapies. Pt.9. Pt.2. HIV1U35926. Pt.7. Patient #6 from. Wolinsky et al. Pt.5. HIVU95460. HIV1U36148. Pt.6. HIV1U36073. HIV1U36015.

E N D
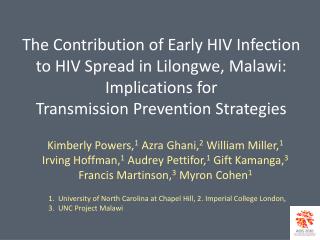
Spread of HIV-1 Infection Formation of Clades Rec0mbinant Strains Differential rates of evolution Novel strategies for development of vaccines and therapies
Pt.9 Pt.2 HIV1U35926 Pt.7 Patient #6 from Wolinsky et al. Pt.5 HIVU95460 HIV1U36148 Pt.6 HIV1U36073 HIV1U36015 HIV1U35980 Pt.8 Pt.1 Pt.3 10% HIV env in 8 men infected in the USA
Subtype B (US) 97 88 1996 Diversity 1.5% higher in 1996 vs. 1992 (p< 0.001) 1992 95 92 95 87 100 100 90 10%
N Group D SIVcpz A / D O Group B F U Kaliningrad: B/A E I Central China outbreak: B/C 10% C H A G J SIVcpz HIV-1 env Genes M Group Clades within the HIV-1 phylogenetic tree are becoming more obscure. Virus chimeras (recombinants) are becoming more evident and are significant in emerging epidemics
Evolution from genomic chimerization (recombination) • One person is infected from two sources • Two virions from different sources infect the same cell
Chimera formation • Each virion goes through reverse transcription, integration and produces viral RNA • One of each RNA is packaged in a single virion • The hybrid virion infects a new cell, reverse transcription occurs and RT switches between templates, creating a chimeric proviral genome
152/164 Days PI PATIENT A COMMON 635 Days PI PATIENT B 887 Days PI PATIENT B UNIQUE HIVSC HIVSC HIVBa1a HIVSFAAA HIVSC HIVBa1a HIVBa1a HIVYU10X HIVSFAAA HIVSFAAA HIVYU10X HIVYU10X pNL43 pNL43 pNL43 0.01 0.01 0.01 Dual Infection and Virus Chimeras in UW PIC Pt. 14 HChimera
Evidence for Recombination • Topological Incongruence along the Genome • Bootscan Analysis • Pairwise Distance Analysis
104 74% 43 109 104 28 54 78 30 30 18 26 109 18 28 55 93 82 57 60 34 32 gp41 49 vpu 26 5 93 5 0.01 0.01 34 60 54 78 62 32 51 43 49 51 57 82 104 104 62 109 57 104 18 54 54 26 18 100% 57 109 78 109 55 30 18 34 43 82 79% 93 28 26 97% 32 28 78 quarter 30 60 32 genome 43 62 5 51 55 93 76% 94% 32 3 4 34 0.001 60 93 55 98% 49 62 60 U3 51 5 51 82 nef 5 62 0.01 82 49 28 71% 54 26 72% 94% 49 57 78 30 0.01 43 Topological incongruence of 3’genome sequences in MACS Pt. 6 (3.0 yrs PI) 104 49 5 109 62 60 30 93 43 vif 51 34 0.01 28 18 26 100% 78 32 55 82 78% 54 57 55
100 90 80 HIV-1-E 70 60 Bootstrap Value (%) 50 40 30 20 10 What is bootscan analysis? • A sliding window phylogenetic analysis that moves along the genome and looks to see when (or if) the sequence being tested changes its clade association on the tree • e.g., The unknown grouping with clade 1 in the gag region and the unknown grouping with clade 2 in the env region
Tree 1 500 bp Tree 2 500 bp Tree 3 500 bp Rec P1 P1 Rec 95 90 P2 P2 Bootscan Example 100 50 Bootstrap Value (%) 0 Region of the Genome
Cautions for the interpretation of Bootscan Analysis • The Bootscan analysis has several potential problems: • It normally uses neighbor joining to produce the tree topologies and often uses the evolutionary substitution models of F84 or Jukes and Cantor. • Neighbor joining has the potential to producing incorrect topologies and this potential can be enhanced by using substitution models that do not accurately describe the pattern of substitution in HIV • Bootscanning procedures look at a sliding window of sequences and produce a number describing the percent of time that the unknown groups with different clades. • The ability to decide if a recombination event has occurred is an arbitrary one. You have to decide if the line dips low enough and long enough to call it a recombination event. Using this technique is in no way a statistical measure of recombination events. There can be several random dips in the bootscan plot that are just random events. • Bootscann procedures have used sliding windows of varied size. • Small windows can add to the problem of identifying the incorrect topology using neighbor joining
100 90 80 70 60 Bootstrap Value (%) 50 40 HIV-1-E 30 20 10 0 gag nef vif pol env vpr Bootscan: HIV-1-E & Simulations
Bootscan: HIV-1-E & Simulations 100 90 80 70 60 Bootstrap Value (%) 50 40 HIV-1-E 30 20 10 0 gag nef vif pol env vpr
What the Kashino-Hasegawa (KH) does • It asks: “Are these two trees significantly different from one another • The comparison is done on the likelihood scores of the two topologies • It tests the null hypothesis that there is no statistical difference in the likelihoods of the two trees.) • Overall, we suggest that the bootscann analysis should be used in conjunction with the KH test to try and statistically prove that a recombination event has taken place. • Bootscanning analysis can locate potential recombination events and the KH test can test the hypothesis of a recombination event taking place.
40 B/D 35 A/E 30 25 20 Sequence Distance (% Divergence) 15 10 5 gag vif nef env pol vpr Pairwise Distance Analysis Intrasubtype Intersubtype 0
Real Data Simulated Data Simulated Pairwise Distance Analysis Comparing Subtypes A and E 40 35 30 25 20 Sequence Distance (% Divergence) 15 10 5 0 gag nef vif pol env vpr
Statistical tests of reported recombinant HIV strains (1) Assigned ReportedVirusGeneregionsubtypeTestScoreBestp valueSignificance ZAM184 pol 3173-3973 C C 6690.35 (best) A 6747.78 57.43 0.0032 YES env-nef 6511-9463 A A 32524.71 (best) C 32619.66 94.94 0.0001 YES 92RW009 pol-vpr 2573-6071 C C 28378.06 (best) A 28806.18 428.12 <0.0001 YES env 6109-8195 A A 22831.00 (best) C 22967.94 136.94 <0.0001 YES MAL gag 789-1883 A A 9571.50 (best) D 9713.38 141.87 <0.0001 YES vpr-env 5559-8751 D D 33543.66 (best) A 33725.95 182.29 <0.0001 YES IBNG gag 789-2292 A A 13962.19 (best) G 14049.00 86.80 <0.0001 YES pol 2293-3173 G G 6442.77 (best) A 6468.69 25.92 0.0096 YES 93BR029 pol 2085-5096 B B 23128.62 (best) F 23276.56 147.94 <0.0001 YES env 6220-8795 F F 27885.77 (best) B 28273.97 388.19 <0.0001 YES
Statistical tests of reported recombinant HIV strains (2) Assigned ReportedVirusGeneregionsubtypeTestScoreBestp valueSignificance BFP90 gag 789-1583 A A 7309.43 (best) J 7346.98 37.54 0.0261 YES G 7338.20 28.77 0.0133 YES env 6261-7312 G G 12646.18 (best) J 12675.35 29.17 0.0225 YES A 12749.43 103.24 <0.0001 YES nef 8424-9463 J J 12280.21 (best) A 12335.76 55.55 0.0003 YES G 12327.69 47.47 0.005 YES 94CY032 gag 789-1883 A A 9611.10 (best) G 9682.93 71.82 <0.0001 YES I 9635.65 24.55 0.012 YES pol 2189-4673 I I 20009.92 (best) A 20140.33 130.41 <0.0001 YES G 20036.07 26.14 0.0423 YES env 6311-6773 G G 4386.51 (best) A 4404.26 17.75 0.0605 NO I 4387.39 0.88 0.9251 NO
Conclusions • The weight of the evidence indicates that E and A are separate phylogenetic groups and not recombinants • Nearly all other reported recombinants reported to date satisfy our criteria • Variations in the rate of evolution along the HIV-1 genome can resemble a recombination event
Lineages observed through time Semi logarithmic Transformation of the number of lineages Log N present time ( ) Time or Sequence Divergence
US B 1996 US B 1992 US Lineages through time 100 Lineages (N) 10 Time () 1 0.12 0.1 0.08 0.06 0.04 0.02 0
US’96 US ‘92 Thai B Thai E US and Thai lineages through time Epidemic transform: 8 mt= ln n0-nt n0nt 7 Time estimates are predicted from values assuming a substitution rate of 0.55%/year 6 5 m (Transformed Number of Lineages) 4 3 2 1 0 1976 1980 1984 1988 1992 1996 Year
Conclusions • Epidemics in the US and Thailand are growing exponentially, with the Thai HIV-1B epidemic growing more rapidly • Coalescent dates for subtype B epidemics in the USA and Thailand are in accordance with epidemiologic data • Coalescent date for subtype E epidemic in Thailand is earlier than predicted from epidemiologic data. • Potential reasons to account for this discrepancy: • Multiple introductions of HIV-1 (no evidence from phylogenetics) • HIV-1 was undetected in Thailand for about 7 years • Mutation rates for subtype E in the C2-C3 region are higher than for subtype B
Novel approaches to HIV Prophylaxis • Ancestral Virus Reconstructions • To minimize differences between vaccine strain and infecting virus • Epidemic-, subtype- and M group-specific • Recovers antigenic recognition sites??? • Antiretroviral Chemoprophylaxis • Once-a-day pill provides protection??? • Eventual induction of protective immunity???
~1996 (n=57) ~1992 (n=40) 97 88 95 92 95 87 100 100 90 10% HIV-1-B env C2-V5 in the USA The accumulation in the number of substitutions along lineages terminating in late timepoint sequences was 1.5% higher in 1996 vs. 1992 (p< 0.001) Thus, temporally accurate strains are more divergent than an ancestor would be from any currently circulating strain
Group O SIV CPZGAB B SIV D CPZUS F H J C G E A AG Group N AGI Group M 10 % Divergence Phylogenetic Classification of HIV-1
186 H915M2 191 H915M2 190 H915M2 188 H915M2 108 H915W6 111 H915W6 H915 114 H915W6 115 H915W6 112 H915W6 118 H915W6 109 H915W6 110 H915W6 117 H915W6 43 H591 55 H591 47 H591 45 H591 46 H591 48 H591 H591 56 H591 • MRCA estimate of • 1000 bp region of gp120 • 97.4% identical to BK28 inoculum • 98.2% when 5 convergent glycosylation sites are removed 51 H591 57 H591 54 H591 49 H591 50 H591 L35597 U18033 MM316ZJ MM132ZC PHTBE5 SIVT5 MNE170 5 changes Accuracy ofancestor predictions (two macaques infected with the same clone-derived SIV inoculum)
MNE170 MRCA estimate is 98.5% identical to 1- F965M4 SIVT5 U18033 177 H615LN 2 183 H615LN 2 117 H915W6 2 172 H042LN 2 176 H615LN 2 173 H042LN 2 171 H042LN 2 179 H615LN 2 174 H042LN 2 137 H042M4 2 119 H615M4 2 170 H042LN 2 133 H042M4 2 182 H615LN 2 MM132ZC 136 H042M4 2 128 H615M4 2 143 H042M4 2 139 H042M4 2 138 H042M4 2 68 I580 2 32 H500 2 67 I580 2 120 H615M4 2 60 I580 2 58 I580 2 46 H591 2 43 H500 2 61 I580 2 54 H591 2 121 H615M4 2 59 I580 2 140 H042M4 2 55 H591 2 33 H500 2 47 H591 2 MM316ZJ 84 H914 2 88 H914 2 PHTBE5 48 H591 2 L35597 49 H591 2 38 H500 2 42 H500 2 83 H914 2 35 H500 2 65 I580 2 126 H615M4 2 34 H500 2 70 I580 2 12 H824 2 43 H591 2 13 H824 2 20 H824 2 56 H591 2 125 H615M4 2 93 H914 2 69 I580 2 37 H500 2 15 H824 2 129 H615M4 2 36 H500 2 89 H914 2 135 H042M4 2 9 H824 2 130 H615M4 2 66 I580 2 64 I580 2 127 H615M4 2 118 H915W6 2 110 H915W6 2 91 H914 2 19 H824 2 63 I580 2 87 H914 2 124 H615M4 2 180 H615LN 2 62 I580 2 40 H500 2 39 H500 2 41 H500 2 21 H824 2 86 H914 2 92 H914 2 50 H591 2 115 H915W6 2 112 H915W6 2 45 H591 2 57 H591 2 134 H042M4 2 51 H591 2 16 H824 2 18 H824 2 11 H824 2 10 H824 2 123 H615M4 2 85 H914 2 190 H915M29 2 14 H824 2 188 H915M29 2 109 H915W6 2 114 H915W6 2 191 H915M29 2 186 H915M29 2 108 H915W6 2 0.001 changes 111 H915W6 2 Accuracy of ancestor predictions(macaques infected with in vivo passaged SIV-BK28 inoculum [F965 strain])
B_ancestor USAD8 HIVZ2Z6 HIVNDK HIVELICG USDH123 US89.6 NLACH320B NLACH32OA MANC HIVYU2X HIVYU10X HIVWEAU160 HIVSF2CG HIVRF HIVPV22 HIVOYI HIVNY5CG HIVNL43 HIVMN HIVMCK1 HIVJRFL HIVJRCSF HIVJC16 HIVHAN2 HIVF12CG HIVCAM1 HIVBH102 D31 CNRL42CG AUMBCD36 AUMBCC98 AUMBCC54 AUMBCC18B AUMBC925 AUMBC200 AUC18MBC AUC18 89SP061 88USWR27 87USSG3X HIVLAICG 0 5 10 15 20 % of consensus epitopes missingwithinHIV-1-B gp160 proteins
Expression of HIV-89.6 Env: COS-7 mixed with GHOST-R5 COS-7 mixed with GHOST-X4 COS-7 Expression of ANC1 Env: COS-7 mixed with GHOST-R5 COS-7 mixed with GHOST-X4
3000 2000 1000 1000 100 10 1 0.1 0 10 20 30 40 Antiretroviral ChemoProphylaxis vag HIV-2 vag SIV PMPA Controls CD4 PMPA IUPM
Inhibitor plus Mutagen -6 -5 -4 0 36 60 84 108 5-FdU AZTHIV1WASH 5-FdU 5-FdU 5-FdU Harvest 5-FdU+AZT AZT AZT AZT P24 (ng/ml) 750 500 250 0 Control HIV alone 5-FdU 25nm AZT 3.2nM AZT 3.2nm 5-FdU 50nM AZT 3.2nM 5-FdU 25nM 5-FdU 50nM