Download
1 / 22
220 likes | 300 Views
Research Supported by. H-mode Research in the National Spherical Torus Experiment. Rajesh Maingi Oak Ridge National Laboratory

E N D
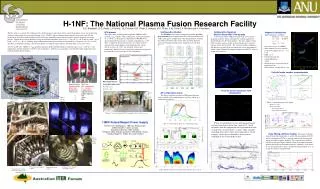
Research Supported by H-mode Research in the National Spherical Torus Experiment • Rajesh Maingi • Oak Ridge National Laboratory • M.G. Bell 2), R.E. Bell 2), C.E. Bush 1), E.D. Fredrickson 2), D.A. Gates 2), T. Gray 3), D.W. Johnson 2), R. Kaita 2), S.M. Kaye 2), S. Kubota 4), H.W. Kugel 2), C.J. Lasnier 5), B.P. LeBlanc 2), R.J. Maqueda 6), D. Mastrovito 2), J.E. Menard 2), D. Mueller 2), M. Ono 2), F. Paoletti 7), S.J. Paul 2), Y-K.M. Peng 1), A.L. Roquemore 2), S.A. Sabbagh 7), C.H. Skinner 2), V.A. Soukhanovskii 2), D. Stutman 8), E.J. Synakowski 2), T. Tan 9), J.B. Wilgen 1), S.J. Zweben 2) • 1) Oak Ridge National Laboratory 2) Princeton Plasma Physics Laboratory • 3) North Carolina State University 4) University of California at Los Angeles • 5) Lawrence Livermore National Laboratory 6) Los Alamos National Laboratory • 7) Columbia University 8) Johns Hopkins University • 9) West-Windsor/Plainsboro High-School North, Plainsboro NJ • 19th IAEA Fusion Energy Conference • Oct. 14-19, 2002 • Lyon, France Page 1
H-modes Obtained Routinely in NSTX • Why is NSTX interested in H-modes? • High stability limit due to low pressure peaking • Long pulse due to low loop voltage • Outline • Confinement and profile changes • Access conditions • Power threshold • Fueling • Edge, Scrape-off Layer, and divertor measurements Underline means difference between ST and conventional aspect ratio tokamaks Page 2
ParametersDesignAchieved Major Radius 0.85m Minor Radius 0.67m Plasma Current 1MA1.5MA Toroidal Field 0.6T0.6T Heating and Current Drive NBI (100keV) 5MW7 MW RF (30MHz) 6MW6 MW Wall Conditioning: 350 deg. bakeout of graphite tiles Regular boronization (~3 weeks) Helium Glow between discharges Center stack gas injection NSTX Explores Low Aspect Ratio (A=R/a) physics regime Graphite tiles Solenoid }A ≥ 1.27 Passive stabilizing plates Page 3
Max bT= 31.5% bNmax ~ 6.2 Min fp(H) ~ 1.9, Min fp(L) ~ 2.6 fppe/<pe> bT = 2mo<p>/B02 Sabbagh, this conference PNBI /10 [MW] H-modes only H-modes and L-modes Ip [MA] Da [a.u.] L-H bt [%] #108103 EFIT02 H-mode Plasmas Achieved High bt, Owing to Reduced Pressure Peaking Factor Page 4
Confinement in Discharges with H-mode or L-mode edge above Conventional Aspect Ratio Scalings Ip [MA] PNBI /5 [MW] bt [%] tE [sec] Da [a.u.] bt x tE [%-sec] #107759 EFIT02 L-H Kaye (LeBlanc this conference) Page 5
ne [1019m-3] #108728 0.710 sec Ip [MA] PNBI/10 [MW] 0.460 sec ne [1019 m-3] 0.260 sec Da [au] #108728 WMHD*10 [MJ] 0.227 sec H98pby2 Density Profile Becomes Hollow after Transition, but Flattens During Long Pulse as Core Rises More Quickly • Inner and outer ‘pedestal’ ne show similar trends • Inner ped. ne> outer ne • Profile requires ~ 300-500 msec to flatten out Page 6
Here Bt = 4.5 kG, Ip = 900 kA, ne =2.4 X 10¹⁹ m-3 • PNBILH = 0.63 MW • PlossLH = 1.2 MW • (PlossLHPoh+PNBI-dW/dt) • At Bt = 4.5 kG, Ip = 600 kA, ne =2.0 X 10¹⁹ m-3 • PNBILH = 0.32 MW • PlossLH = 0.63 MW • Ip dependence, strong ne • dependence, or PLH coming • down with conditioning? Plasma Current [MA] NBI Power [MW] Da [au] Dithers tE [sec] Stored Energy [kJ] Time [sec] L-H Power Threshold (Pth) Studies CommencingNSTX will provide data for international scalings Bush Page 7
High-Field Side Gas Injector Fueling Allows Early L-H Transition and Longer H-mode Duration Page 8
High-Field Side Gas Injector Fueling Allows Higher Toroidal Rotation and Edge Te Page 9
LSN ELM LSN Internal DN DN Wide Spectrum of ELM Characteristics Observed in NSTX 250 Hz • DW/W0 <1% • DW/W0: 5-25% • DW/W0: 1-4% • DW/W0: << 1% 135 Hz 600 Hz Bush Page 10
Large ELMs dump edge plasma from r/a > 0.4 DWmax/W0~ 20% • Some times returns to sustained L-mode Thomson Times H-mode Bush Page 11
#105710 0.215 sec (H) GPI view 12 cm Radial vs. poloidal imaging Gas manifold Side-viewing re-entrant window 0.230 sec (L) Gas Puff Imaging Shows a Narrower , More Quiescent Emission Pattern in H-mode than L-mode • Image distributed gas puff of Helium (or Deuterium) • View looks directly at field lines core SOL Zweben, Maqueda Page 12
ne [1019 m-3] L-Mode 1 10 100 1000 Frequency (kHz) L-H transition causes a substantial drop in fluctuations in plasma edge, seen in profiles and in fluctuation spectra Frequency (kHz) • Density scans are 200 ms apart • H-mode plasmas more quiescent than L-mode • Fluctuation frequency spectrum shows large decrease in H-mode from L-mode 0.7 0.6 0.5 0.4 0.3 0.2 0.1 0.0 Frequency (kHz) Density fluctuation spectra 108316 100 10-1 10-2 10-3 10-4 10-5 10-6 108317 0.150 s L-mode L-Mode 0.7 0.6 0.5 0.4 0.3 0.2 0.1 0.0 H-Mode Relative Power H-mode H-Mode 108317 0.205 s 1.50 1.52 1.54 1.56 1.58 Wilgen, Hanson, Ryan, Swain Page 13
Peak heat flux Increased with NBI powerPeak heat flux higher in L-mode at same NBI power • Peak heat flux increased • faster than linear with PNBI • Highest qpeak ~ 10 MW/m2 • Higher SOL power in L-mode • Poh higher, dW/dt lower • L-mode has similar power • accountability to H-mode: • Pdivin+out ~ 70% of PSOL Page 14
H-modes Obtained Routinely in NSTX • Reproducible H-mode access aided progress toward NSTX performance goals • tE somewhat higher than low aspect ratio scalings • ne profile hollow following transition but fills in 300-500msec • Power threshold studies commencing; PLHloss ~ 0.6 -1.2 MW • Fueling location (and rate) affects L-H transition dynamics • Variety of ELMs observed; low d single-nulls and high d double-nulls have different characteristics • H-mode edge and SOL plasma less turbulent than L-mode • Peak heat flux in H-mode increased with NBI; power accountability good Page 15
Backup Slides Page 16
Ip [MA] PNBI/10 [MW] ne [1019 m-3] Da [a.u.] bp Vloop [V] Stored Energy [kJ] #109063 EFIT01 L-H H98 [pby2] H-mode Plasmas Achieved Long Pulse, Owing to Low Volt-Second Consumption Rate Page 17
Density Profile Becomes Hollow after Transition, but Flattens During Long Pulse as Core Rises More Quickly • Inner and outer ‘pedestal’ • ne show similar trends • Inner ped. ne> outer ne • Profile requires ~ 300- • 500 msec to flatten out Page 18
Plasma Current [MA] NBI Power [MW] Da [au] Stored Energy [kJ] tE [s] Time [sec] Comparable performance and improved reproducibility w/high-field side fueled H-mode (blue) over wall pre-loaded H-mode (black) Page 19
High Fraction of SOL Power Observed in Divertor During H-modes Ip [MA] PNBI/5 [MW] WMHD*10 [MJ] ne/nGW PSOL Pdivin Pdivout (Pdivout +Pdivin)/PSOL #109034 PSOL=Paux+Poh-dW/dt • Both inner and outer side • profiles come to equilibrium • Power flow to outer side is • three times inboard side • L-mode has similar power • accountability • qpeak increased with PNBI Page 20
Peak Heat Flux in High Confinement Mode Would Lead to Tile Overheating for ~ 3sec pulse length 12 10 8 6 4 2 0 Heat Flux [MW/m2] 300 ms 400 ms 500 ms EFIT #109051 t=300ms 0 0.2 0.4 0.6 0.8 1.0 Divertor Tile Radius [m] Page 21
Profiles Show Reduced Fluctuations After H-mode Transition15 consecutive sweeps in each frame (m) (ms) Wilgen, Hanson, Ryan, Swain Page 22