Download
1 / 15
150 likes | 214 Views
What is it all about?. Background. Two experimental domestic energy studies carried out ( Wattsup 1 & Power Ballads 2 - excuse the puns!) delivering ‘socially enabled’ energy feedback from Facebook applications. Design, implementation and findings. Other energy work in progress.

E N D
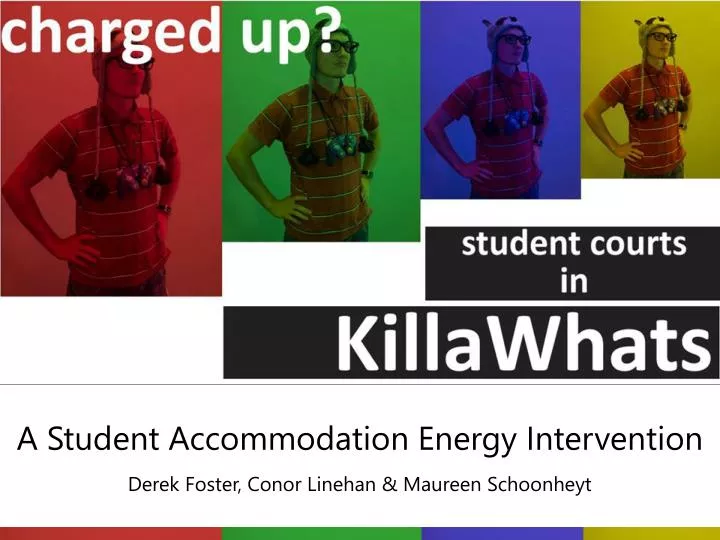
What is it all about? • Background. • Two experimental domestic energy studies carried out (Wattsup1 & Power Ballads2 - excuse the puns!) delivering ‘socially enabled’ energy feedback from Facebook applications. • Design, implementation and findings. • Other energy work in progress. A Student Accommodation Energy Intervention Derek Foster, Conor Linehan & Maureen Schoonheyt
What is it about? Energy
What is it about? • Design a technology-led intervention to change behaviour • Bringing about a change in end-user (student) energy demand • Using a technology-platform to deliver an energy feedback intervention that is: • Engaging • Cool • Social
Why? • Promote more sustainable energy-use practices. • Lower UoL CO2 footprint. • Supports UoL strategic plan. • Good for the environment, good for you, good for everyone.
Energy use in UoL Student Accomodation 1,202,698 kWh = 630,957 kgCO2= £120,269 inrunning costs a 5% reduction would save 31547 kgCO2 p.a saving £6013 p.a
How? • By using a user-centred design approach – of course! • This is what this HCI module is all about. • The skills you will learn here, and the work you carry out will directly support real-world research in the KillaWhats project. • Qualitative research • Focus groups • Interviews • Prototyping
Energy Feedback The following attributes apply to energy and Co2: Intangible Invisible Colourless Odourless Effects are temporal With these qualities how can we effectively visualise energy use that is both meaningful and engaging?
Energy Feedback Attempts have been made to visualise for the home, by companies:
Energy Feedback Attempts have been made by the HCI research community: Anton Gustafsson and Magnus Gyllenswärd. 2005. The power-aware cord: energy awareness through ambient information display. In CHI '05 extended abstracts on Human factors in computing systems (CHI EA '05). ACM, New York, NY, USA, 1423-1426. Petkov, Petromil, Köbler, Felix, Foth, Marcus, & Krcmar, Helmut (2011) Motivating domestic energy conservation through comparative, community-based feedback in mobile and social media. In Proceedings of the 5th International Conference on Communities & Technologies (C&T 2011), ACM, Brisbane, pp. 21-30.
Energy Feedback Attempts have been made by us: http://eprints.lincoln.ac.uk/4104/
Energy Feedback Attempts have been made by us:
The Design Challenge Building on our own and others’ research of making energy feedback more engaging and cool the challenge is to: “Design a technology-led and socially-enabled energy intervention; that is both engaging and cool, for students in official accommodation blocks, that encourages more sustainable energy-use practices.“
Design Task 1 • A brainstorming session where you – as groups – will devise (on paper) some energy visualisation designs for a given theme and target user group. • The designs should work towards making energy consumption easier to understand with a view for reductions. • You will work in groups of around 6/7. Each group will be assigned a number and receive a random user group. • You then have 30 minutes to devise your visualisation (make sure it has a name!) and to devise your elevator pitch. • We will then sit through your 1 minute elevator pitches.