Download
1 / 8
80 likes | 197 Views
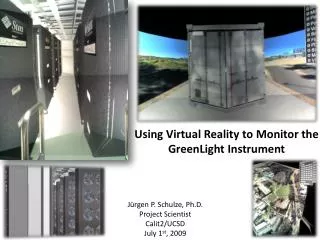
Using Virtual Reality to Monitor the GreenLight Instrument. J ü rgen P. Schulze, Ph.D. Project Scientist Calit2/UCSD July 1 st , 2009. 360 degree immersive virtual reality 15 screens on 5 walls, ~8 x 4 foot each, plus floor projection Passive stereo, circular polarization

E N D
Using Virtual Reality to Monitor the GreenLight Instrument Jürgen P. Schulze, Ph.D. Project Scientist Calit2/UCSD July 1st, 2009
360 degree immersive virtual reality 15 screens on 5 walls, ~8 x 4 foot each, plus floor projection Passive stereo, circular polarization 18 Dell XPS PCs with Quad Core Intel CPUs Dual NvidiaQuadro 5600 graphics cards per node 34 JVC HD2k (1920x1080 pixels), ~34 megapixels per eye Optical tracking system with four cameras by ART CentOS5.2 Linux ROCKS cluster management software Trackd tracker interface The StarCAVE
Real-Time Display of Power Consumption • Currently all eight PDUs are supported • All three phases on each PDU are supported • Several scalings available • Graphs generated by downloading PDU generated graph images
Interactive Component Selection • 3D mouse cursor selects component of interest (PC, switch, PDU, etc.) • Each unit has unique ID • Visualization tool has data bank of all components and displays name, type, location.
Future Work • Access more sensor data: • power consumption of individual nodes • fan speed • CPU temperature • Create self-explanatory interactive visualization tool • Run permanently on dedicated display hardware for researchers to access at all times