Download
1 / 39
520 likes | 741 Views
Mass Spectrometry. Analytical method to measure the molecular or atomic mass of samples. MS Principles. Different elements can be uniquely identified by their mass. MS Principles. N. -CH 2 -. OH. COOH. HO. -CH 2 CH-NH 2. HO. HO.

E N D
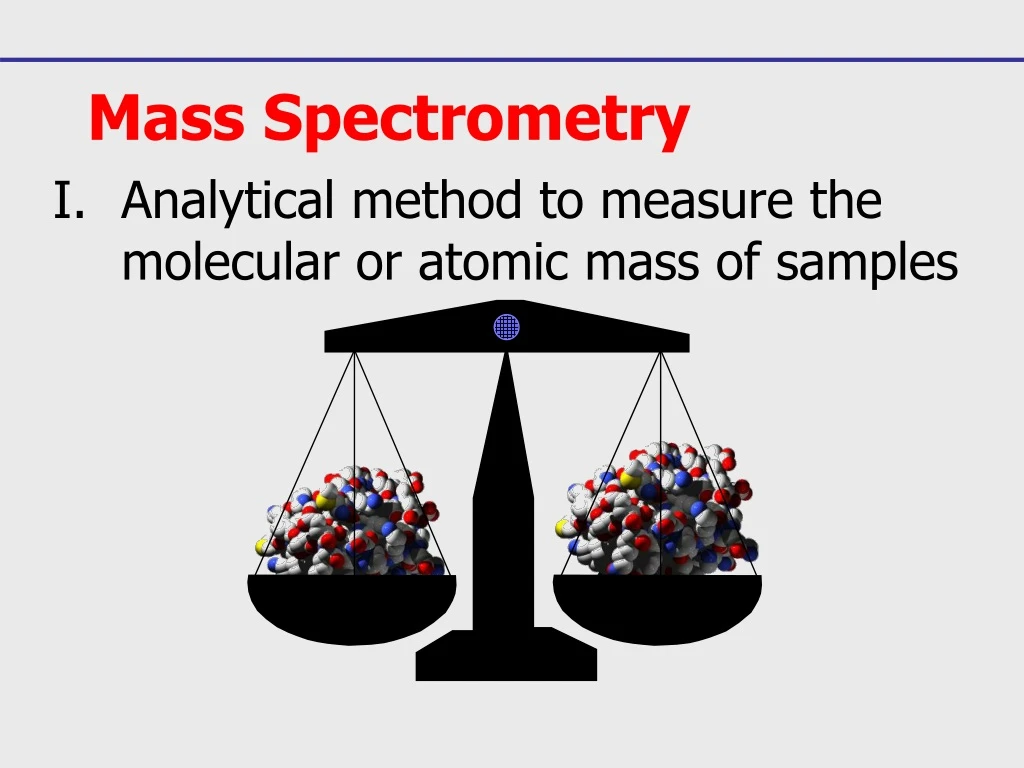
Mass Spectrometry • Analytical method to measure the molecular or atomic mass of samples
MS Principles • Different elements can be uniquely identified by their mass
MS Principles N -CH2- OH COOH HO -CH2CH-NH2 HO HO • Different compounds can be uniquely identified by their mass Butorphanol L-dopa Ethanol CH3CH2OH MW = 327.1 MW = 197.2 MW = 46.1
Mass Spectrometry • For small organic molecules the MW can be determined to within 5 ppm or 0.0005% which is sufficiently accurate to confirm the molecular formula from mass alone • For large biomolecules the MW can be determined within an accuracy of 0.01% (i.e. within 5 Da for a 50 kD protein) • Recall 1 dalton = 1 atomic mass unit (1 amu)
Mass Spectrometry • Introduction • General overview • Mass Spectrometry is the generation, separation and characterization of gas phase ions according to their relative mass as a function of charge • Previously, the requirement was that the sample be able to be vaporized (similar limitation to GC), but modern ionization techniques allow the study of such non-volatile molecules as proteins and nucleotides • The technique is a powerful qualitative and quantitative tool, routine analyses are performed down to the femtogram (10-15 g) level and as low as the zeptomole (10-21 mol) level for proteins • Of all the organic spectroscopic techniques, it is used by more divergent fields – metallurgy, molecular biology, semiconductors, geology, archaeology than any other
Mass Spectrometry • The Mass Spectrometer • General Schematic • A mass spectrometer needs to perform three functions: • Creation of ions – the sample molecules are subjected to a high energy beam of electrons, converting some of them to ions • Separation of ions – as they are accelerated in an electric field, the ions are separated according to mass-to-charge ratio (m/z) • Detection of ions – as each separated population of ions is generated, the spectrometer needs to qualify and quantify them • The differences in mass spectrometer types are in the different means to carry out these three functions • Common to all is the need for very high vacuum (~ 10-6 torr), while still allowing the introduction of the sample
Mass Spectrometry • The Mass Spectrometer • Single Focusing Mass Spectrometer • A small quantity of sample is injected and vaporized under high vacuum • The sample is then bombarded with electrons having 25-80 eV of energy • A valence electron is “punched” off of the molecule, and an ion is formed
Mass Spectrometry • The Mass Spectrometer • The Single Focusing Mass Spectrometer • Ions (+) are accelerated using a (-) anode towards the focusing magnet • At a given potential (1 – 10 kV) each ion will have a kinetic energy: ½ mv2 = eV As the ions enter a magnetic field, their path is curved; the radius of the curvature is given by: r = mv eH If the two equations are combined to factor out velocity: m/e = H2r2 2V
Mass Spectrometry • The Mass Spectrometer • Single Focusing Mass Spectrometer • At a given potential, only one mass would have the correct radius path to pass through the magnet towards the detector • “Incorrect” mass particles would strike the magnet
Background • The cations that are formed are separated by magnetic deflection.
Mass Spectrometry • The Mass Spectrometer • Single Focusing Mass Spectrometer • By varying the applied potential difference that accelerates each ion, different masses can be discerned by the focusing magnet • The detector is basically a counter, that produces a current proportional to the number of ions that strike it • This data is sent to a computer interface for graphical analysis of the mass spectrum
Mass spectrometry is a very powerful method to analyse the structure of organic compounds, but suffers from 3 major limitations: Compounds cannot be characterised without clean samples This technique has not the ability to provide sensitive and selective analysis of complex mixture For big molecules like peptides spectra are very complex and very difficult to interpret
Lets talk about mass! • Atomic mass of Carbon • Atomic mass of Chlorine • Atomic mass of Hydrogen
Lets talk about mass! • Atomic mass of Carbon • 12.000000000000000000000000000 amu • Atomic mass of Chlorine • 35.4527 amu • Atomic mass of Hydrogen • 1.00794 amu 1amu = 1 dalton (Da)
What about isotopes? • Atomic mass of Carbon • 12.000 amu for 12C but 13.3355 for 13C • Atomic mass of Chlorine • 34.9688 amu for 35Cl and 36.9659 for 37Cl • Atomic mass of Hydrogen • 1.00794 amu for H and 2.0141 for D!
Just for clarification • Atomic mass • amu, atomic mass units (uma??) • “Da” or Dalton. • kD (kiloDalton for macromolecules) • 1 amu = 1.66056*10-27 kg. • proton, mp = 1.67265*10-27 kg, • neutron, mn = 1.67495*10-27 kg.
Ways to define and calculate the mass of an atom, molecule or ion • Average mass: calculated using the atomic weight, which is the weighted average of the atomic masses of the different isotopes of each element in the molecule. Often used in stoichiometric calculations. • Nominal mass: calculated using the mass of the predominant isotopes of each element rounded to the nearest integer value that corresponds to the mass number. • Monoisotopic mass: calculated using the extract mass of the most abundance isotope for each constituent element. Use monoisotopic mass if possible in MS
Differences between Masses C20H42 C100H202 Nominal: (20 x 12) + (42 x1) = 282 u (100x12) + (202x1) = 1402u Monoisotopic: (20 x12) + (42 x 1.007825) = 282.33 (100x12) + (202x1.007825) = 1403.5807 Average: (20 x 12.011) + (42 x 1.00794) = 282.5535 (100x12.011)+(202x1.00794) = 1404.7039
(a) only one chlorine atom (b) only one bromine atom 1:1 3:1 35Cl: 75.77 37Cl: 24.23 79Br: 50.69 81Br: 49.31 3:4:1 c) one chlorine and one bromine atom
Mass Spectrometry • The Mass Spectrometer • Double Focusing Mass Spectrometer • Resolution of mass is an important consideration for MS • Resolution is defined as R = M/DM, where M is the mass of the particle observed and DM is the difference in mass between M and the next higher particle that can be observed • Suppose you are observing the mass spectrum of a typical terpene (MW 136) and you would like to observe integer values of the fragments: For a large fragment: R = 136 / (135 – 136) = 136 For a smaller fragment: R = 31 / (32 – 31) = 31 Even a low resolution instrument can produce R values of ~2000! • If higher resolution is required, the crude separation of ions by a single focusing MS can be further separated by a double-focusing instrument
Mass Spectrometry • The Mass Spectrometer • Double Focusing Mass Spectrometer • Here, the beam of sorted ions from the focusing magnet are focused again by an electrostatic analyzer where the ions of identical mass are separated on the basis of differences in energy • The “cost” of increased resolution is that more ions are “lost” in the second focusing, so there is a decrease in sensitivity
Mass Spectrometry • The Mass Spectrometer • Quadrupole Mass Spectrometer • Four magnets, hyperbolic in cross section are arranged as shown; one pair has an applied direct current, the other an alternating current • Only a particular mass ion can “resonate” properly and reach the detector The advantage here is the compact size of the instrument – each rod is about the size of a ball-point pen
Mass Spectrometry • The Mass Spectrometer • Quadrupole Mass Spectrometer • The compact size and speed of the quadrupole instruments lends them to be efficient and powerful detectors for gas chromatography (GC) • Since the compounds are already vaporized, only the carrier gas needs to be eliminated for the process to take place • The interface between the GC and MS is shown; a “roughing” pump is used to evacuate the interface Small He molecules are easily deflected from their flight path and are pulled off by the vacuum; the heavier ions, with greater momentum tend to remain at the center of the jet and are sent to the MS
Mass Spectrometry • The Mass Spectrum • Presentation of data • The mass spectrum is presented in terms of ion abundance vs. m/e ratio (mass) • The most abundant ion formed in ionization gives rise to the tallest peak on the mass spectrum – this is the base peak base peak, m/e 43
Mass Spectrometry • The Mass Spectrum • Presentation of data • All other peak intensities are relative to the base peak as a percentage • If a molecule loses only one electron in the ionization process, a molecular ion is observed that gives its molecular weight – this is designated as M+ on the spectrum M+,m/e 114
Mass Spectrometry • The Mass Spectrum • Presentation of data • In most cases, when a molecule loses a valence electron, bonds are broken, or the ion formed quickly fragment to lower energy ions • The masses of charged ions are recorded as fragment ions by the spectrometer – neutral fragments are not recorded ! fragment ions
Mass Spectrometry • The Mass Spectrum • Determination of Molecular Mass • When a M+ peak is observed it gives the molecular mass – assuming that every atom is in its most abundant isotopic form • Remember that carbon is a mixture of 98.9% 12C (mass 12), 1.1% 13C (mass 13) and <0.1% 14C (mass 14) • We look at a periodic table and see the atomic weight of carbon as 12.011 – an average molecular weight • The mass spectrometer, by its very nature would see a peak at mass 12 for atomic carbon and a M + 1 peak at 13 that would be 1.1% as high - We will discuss the effects of this later…
Mass Spectrometry • The Mass Spectrum • Determination of Molecular Mass • Some molecules are highly fragile and M+ peaks are not observed – one method used to confirm the presence of a proper M+ peak is to lower the ionizing voltage – lower energy ions do not fragment as readily • Three facts must apply for a molecular ion peak: • The peak must correspond to the highest mass ion on the spectrum excluding the isotopic peaks • The ion must have an odd number of electrons – usually a radical cation • The ion must be able to form the other fragments on the spectrum by loss of logical neutral fragments
Mass Spectrometry • The Mass Spectrum • Determination of Molecular Mass • The Nitrogen Rule is another means of confirming the observance of a molecular ion peak • If a molecule contains an even number of nitrogen atoms (only “common” organic atom with an odd valence) or no nitrogen atoms the molecular ion will have an even mass value • If a molecule contains an odd number of nitrogen atoms, the molecular ion will have an odd mass value • If the molecule contains chlorine or bromine, each with two common isotopes, the determination of M+ can be made much easier, or much more complex as we will see
Molecular Formulas – What can be learned from them Remember and Review! The Rule of Thirteen – Molecular Formulas from Molecular Mass – Lecture 1 When a molecular mass, M+, is known, a base formula can be generated from the following equation: M = n + r 13 13 the base formula being: CnHn+ r For this formula, the HDI can be calculated from the following formula: HDI = ( n – r + 2 ) 2
Rule of 13 • The rule of 13 will give you a molecular formula for the alkane (C and H) for a corresponding molecular weight. Some examples follow. • Assume you have a molecular weight of 400. Divide 400 by 13 which gives you 30.7692. Thirty is the number of carbon atoms. Mutiply the remainder (.7692) times 13 to get 10. Add this number, 10, to the whole number, 30, to get the number of hydrogens, 40. So the molecular formula is C30H40 which equals 400. • b) Assume you have a compound that you think is caffeine. You do a mass spectrum and it gives you a molecular weight of 194. Dividing 194 by 13 gives you 14.9231. Multiplying 0.9231 by 13 gives you 12. Therefore, the molecular formula of the alkane is C14H26. Caffeine has four nitrogen atoms and two oxygen atoms which equals 88. Subtract 6 carbons and 16 hydrogens to get 88. Therefore, the molecular formula for caffeine is C8H10N4O.
Molecular Formulas – What can be learned from them Remember and Review! The Rule of Thirteen The following table gives the carbon-hydrogen equivalents and change in HDI for elements also commonly found in organic compounds:
Mass Spectrometry • The Mass Spectrum • High Resolution Mass Spectrometry • If sufficient resolution (R > 5000) exists, mass numbers can be recorded to precise values (6 to 8 significant figures) • From tables of combinations of formula masses with the natural isotopic weights of each element, it is often possible to find an exact molecular formula from HRMS Example: HRMS gives you a molecular ion of 98.0372; from mass 98 data: C3H6N4 98.0594 C4H4NO2 98.0242 C4H6N2O 98.0480 C4H8N3 98.0719 C5H6O2 98.0368 gives us the exact formula C5H8NO 98.0606 C5H10N2 98.0845 C7H14 98.1096