Download
1 / 39
400 likes | 565 Views
Overview and Methodology Poverty Environment Nexus (PEN) study. World Bank Magda Lovei, Jostein Nygard and Rob Swinkels. Presentation Overview. Why Focus on PEN in Vietnam Methodology Poverty Indicators Environment Indicators Linkages between Poverty and Environment

E N D
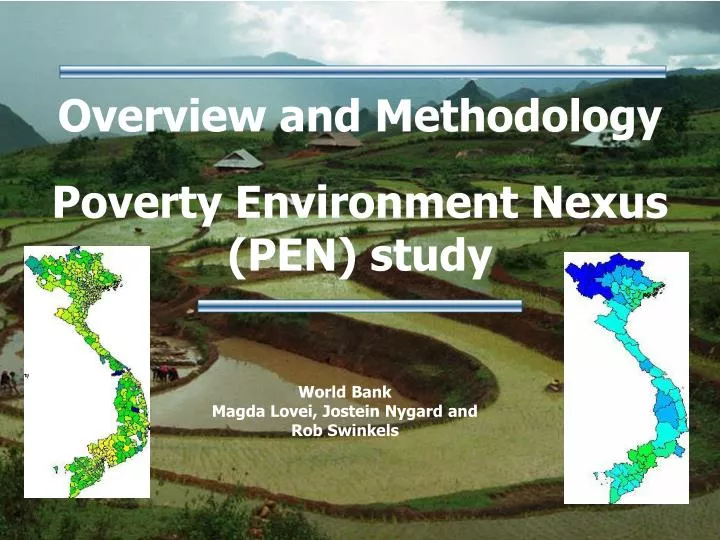
Overview and Methodology Poverty Environment Nexus (PEN) study World Bank Magda Lovei, Jostein Nygard and Rob Swinkels
Presentation Overview • Why Focus on PEN in Vietnam • Methodology • Poverty Indicators • Environment Indicators • Linkages between Poverty and Environment • Selection Criteria and Program Structure
Understand poverty environment linkages. Embed environment into poverty reduction strategies. Objective: Study designed to identify specific project proposals addressing both poverty alleviation and environmental protection. Why Focus on PEN in Vietnam
Country Context • Economic growth i) GDP growth around 7.5 percent ii) Industrial growth at around 16 percent ii) Foreign Direct Investment increasing at present • Poverty Reduction • Especially in low lands • Poverty persists in mountainous and central highlands Economic Growth Poverty Reduction
A study that identifies cases where poverty reduction and environmental protection are complementary goals (win-win situations) What is the PEN study?
Direction of causality typically difficult to establish -Are poor people the main victims of degradation? Do poor people cause environmental degradation? Importance of many intervening variables (e.g., fuel choice, hygiene practices) Analytical challenge (i)
Empirical Evidence is relatively limited Environmental problems tend to be related to natural resource base and thus inherently spatially defined Analytical Challenge (ii)
Phase I: Modes of analysis adapted to limited data availability and quality Correlation analysis - Mapping Regressions - Rankings Phase II: Further national level analysis complements case studies (increasingly demand led) Commune, Village, household, plot level data collection in sample regions Relatively small samples, not statistically significant at higher levels of aggregation Mix of qualitative and quantitative questions (usually respondent assessment, not measured) Methodology
3. Poverty Indicators Poverty in Vietnam at various administrative levels the way forward
One definition: being poor is not being able to meet your basic consumption needs (food, clothes, housing etc). This can be measured through determining someone’s income or consumption expenditure Non-monetary poverty also important Inequality: relative poverty Poverty definition
The Vietnam Household Living Standard Survey (VHLSS) is by far the best data source on poverty in Vietnam It uses one fixed method across the whole country It is internationally recognized as being top class MoLISA poverty rates are ‘subjective’ and cannot be compared across commune, districts or provinces. They are unreliable at the aggregate level And they are driven by targets set in advance Which data on poverty in Vietnam are reliable?
Identify a basket of goods that one needs in Vietnam to lead a decent live. The value of this set of goods is the poverty line This can be calculated using the VHLSS Poverty incidence: proportion of people who consume less than the poverty line How to determine a poverty line
In 2002 the GSO ‘expenditure’ poverty line was VND 160,000 per capita per month (average for both urban and rural) But in 2004 GSO and MoLISA jointly updated the basket of goods and agreed that the new poverty line for 2005 is VND 200,000 (rural areas) VND 260,000 (urban areas Poverty lines (cont’d)
And thus can only measure poverty at the national and provincial level. For sub-provincial level one can use ‘poverty mapping’ techniques VHLSS is a sample survey
It identifies ‘proxy-indicators’ that are closely related to consumption expenditure (education level, type of house, assets etc) The national census has data on proxy-indicators for everyone in Vietnam Thus census can be used to estimate expenditure for everyone and then estimate commune and district level poverty rates What is poverty mapping?
Poverty rates at three administrative levels using poverty mapping
This measures how many poor people live in a particular area. It shows where in Vietnam most poor people live Poverty density
This measures how far below the poverty line the poor are. The farther someone’s expenditure is below the poverty line the ‘deeper’ their poverty Depth of poverty
This shows the total of the poverty gap of all poor people in an area (district) Combining poverty depth & poverty density
Sustainable Land Use Indicators Forest cover, Land gradient Access to Water and Sanitation Industrial Pollution Indoor Air Pollution Outdoor Air Pollution Health Impacts Natural Disasters Environment Indicators
Environment data collection isn’t systematic National: Often based on administratively reported data rather than on independent and consistent measurement (e.g. forest cover trends from village reporting rather than from satellite interpretation) Regional: Mekong River Commission generates and compiles valuable base data Contradiction between different data sources, especially out of sectors with large- household surveys (e.g. natural resources and pollution). Many data gaps and often very little information over time Challenges in data access
Environment Indicators Deforestation Rate Forest Cover • Massive deforestation in last 4 decades • Agricultural • Population • Commercial • Largest forest loss occurring in area with high poverty • Poor do not benefit from commercial logging
Methods – Correlation Analysis District-level Rural Poverty and Natural Forest area ρ = 0.45 Date sources: Govt of Vietnam
Methods – Map overlays • Elevation zones are one of several indicators where overlays with poverty are useful. Poverty rates, 1999
Methods – Map overlays • Poverty rates increase with elevation, but numbers of poor are highest in low elevation areas
Poor Area Vs Poor People Upland • Low poverty density(small absolute number of poor) • High poverty rates • Remaining natural resources (forests, wildlife) • Poor access to services and economic opportunities Lowland • High poverty density (large number of poor) • Low poverty rates • More dynamic economy in cities and highly dynamic rural areas • Comparatively more severe environmental problems due to pollution and overuse of resources such as water
Prioritized sectors in poverty reduction plans Number of poor affected Severity of effects (income, health, vulnerability, social/cultural) Alleviated by national economic growth? Local capacity (institutional, financial) Cost effectiveness (including administration cost) Selection Criteria
PEN Studies (Vietnam) • Vietnam: (TORs, design completed) • Industrial Pollution & poverty Case • Studies in the Red River Basin, • 2nd data collection in 13 provinces • Vietnam: (TORs, design completed) • Song Cau River Baisn , upstream • and downstream with MPI Vietnam: (Ongoing) - Land Administration – Poverty with MONRE (part case studies) Vietnam: (Ongoing) - Clean Water, Sanitation, indoor air pollution, health effects, poverty. National wide study • Vietnam: (Completed) • Pesticide use – Poverty • (partly with MONRE) 6 pro- • vinces in the MRD
Presentation of four individual PEN case studies (“green” and “brown” PEN agenda). Presentation of PEN case study (Song Cau) reflecting several PEN sectors. Discuss possible incorporation of PEN findings into SEDP and poverty reduction plans. Agenda for the workshop