Download
1 / 26
260 likes | 373 Views
Alistair Hunt Department of Economics, University of Bath University of Exeter September 24 th 2009. Economic Appraisal of Climate Change Adaptation at the Local Level. Contents of Presentation. Motivation for research

E N D
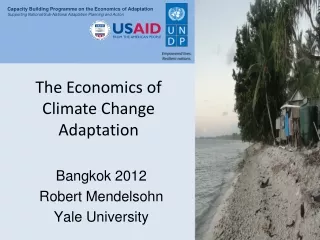
Alistair Hunt Department of Economics, University of Bath University of Exeter September 24th 2009 Economic Appraisal of Climate Change Adaptation at the Local Level
Contents of Presentation • Motivation for research • Estimating economic welfare costs of CC impacts at local scale, within UK. • Some aspects of the economics of adaptation to climate change
Motivation for Research • Essentially practical • Scope size of potential CC impact costs/benefits to inform national & sectoral decisions • Formulation of policy on CC adaptation at any level, involves trade-offs: • Comparing costs of adaptation, versus future damages resulting from inaction. • Relative risks facing different sectors/regions
Stylised Analytical Framework: No CC Impacts/Adaptation Impacts (e.g. average annual total market and non-market damages of flood) e.g. River Floodingin UK Influence of Socio-economic change - e.g. increase in number of properties, change in occupancy rates, change in value of property / contents Projected Baseline Impacts ‘without’ Climate Change (no adaptation) Time 2002 2030 2050 2080 Historical analogue (1-250 yr flood) (NB only linear to simplify presentation)
Physical Impact Assessment • Use of Socio-Economic scenarios to: • Quantify magnitude of physical impacts under CC scenarios relative to climate baseline on consistent SE scenarios • Inform unit values ( e.g. changing with GDP growth per capita) • Use scenarios developed for UK Climate Impacts Programme • Up to 2050s, linear extrapolation to 2080s
Interpretation of Socio-Economic scenarios • Key dimensions of socio-economic change include: • Governance & capacity of institutions at different levels to manage change. • Orientation of social and political values • 4 scenarios (UKCIP, 2002) • World markets • National Enterprise • Local Stewardship • Global Sustainability
Use of SES : River flooding example • Quantitative: population and household size • Qualitative:
Stylised Analytical Framework Impacts (e.g. average annual total market and non-market damages of flood) Future Impacts ‘with’ Climate Change & no Adaptation (predicted change in return period) Gross annual average cost of climate change Impact of climate change on return period Projected Baseline ‘without’ Climate Change & no Adaptation Time 2002 2030 2050 2080
Generic methods for linking climate variables with physical impacts • Using historical analogues of weather extremes to identify impacts. • E.g. flooding events. • Sectors: Building, Transport • Simulation modeling of behavioural change • E.g. carbon enrichment • Sectors: Tourism, Health, Agriculture and Biodiversity • Stakeholder-led and Ad-hoc projections • E.g. retailing responses to warmer summers • Sectors:Retail & Manufacturing, Water, Energy
Physical Impact Assessment • Climate data • Basis: UKCIP02 Climate scenarios Data presented for: • precipitation & temperature • 5 X 5 km areas • individual months • in three time-slices of 30 years covering 2010 – 2100 Assume climate change manifests itself either by: • -changes in means of climate variableor; • -climate variability (extremes)
Results – 2080s time-sliceAnnual Average Welfare Costs (£ million, 2004 prices) (-ve denotes benefit)
Results – 2080s time-sliceChanges in Consumer Expenditure (£ million, 2004 prices) -ve denotes reduction in consumer spend; +ve denotes increase in consumer spend
Annual Impact multipliers over baseline (2011–2040 time period, undiscounted)
Stylised Analytical Framework Impacts (e.g. average annual total market and non-market cost of flood) Future Impacts ‘with’ Climate Change & no Adaptation Gross benefit of adaptation for comparison with costs of adaptation Future Impacts (‘with’ Climate Change) after Adaptation (e.g. reduction in predicted return period) Residual Impacts of Climate Change Projected Baseline ‘without’ Climate Change & no Adaptation Time 2002 2030 2050 2080
Application to Flood Management • Riverine flood risks in Shrewsbury, Shropshire • Impacts • Direct physical damage to residential and non-residential property • Forgone output from short-term disruption to non-residential properties. • Direct impacts on human health (mortality, injuries and stress).
Total damage costs associated with different flood frequencies in Shrewsbury (£'000s)
Application to Flood Management • Riverine flood risks in Shrewsbury, Shropshire • Adaptation • Key problem: uncertainty in impacts may result in inappropriate level or type of adaptation May be better to adopt a portfolio of options that reflect the decision-makers’ preferences relating to (economic?) optimisation versus reducing the chances of getting it wrong (variance from the “optimal”)
Flood management decision-making: portfolio analysis • Portfolio Analysis • utilises the principle that since individual assets are likely to have different and unpredictable rates of return over time, an investor should ensure that she maximises the expected rate of return and minimises the variance and co-variance of her asset portfolio as a whole rather than aim to manage the assets individually, (Markowitz (1952)). • As long as the co-variance of assets is low then the overall portfolio risk in minimised, for a given rate of overall return.
Flood management decision-making: portfolio analysis • economic efficiency criterion (Net Present Value) is, here, the principal determinant of the measure of portfolio return. Also measure NPV variance as indicator of uncertainty • instead of appraisal of single flood response options using the economic efficiency criterion, a group of options are collectively appraised. • may be better able to capture variations in effectiveness of responses across a wider range of possible (climatic and socio-economic) futures.
Economic returns to flood management options • 3 options: hard defence; property resistance; warning system • CBA for each option • Three degrees of implementation (20%, 50%, 100%) • Constant-scale economies in costs assumed • Four (consistent) CC/SE scenario combinations • Portfolios created from combinations of two options and three options, each option disaggregated according to degree of implementation
Results • Economic efficiency – variance trade-off exists for both 2 and 3 option portfolios • Sub-optimal portfolios can be identified • Hard defences generally contribute most to higher NPV and higher variance; property resistance option has opposite effect.
Conclusions • Seems possible to scope out identified climate change impacts against specified climate scenarios, though socio-economic scenarios add significant (even more!) complexity • Adaptation assessment may be enriched by use of portfolio analysis – incorporates uncertainty more explicitly into decision-making. But reliant on reliable, quantitative data relating to both the costs and benefits of identified adaptation options. • Future research priorities may, inter alia, include: • Applying portfolio analysis within a portfolio of alternative decision rules • Improving representation of non-market values within decision rules • Application of non-market valuation techniques to evaluation of “softer”, behavioural-based, adaptation options