Download
1 / 24
330 likes | 621 Views
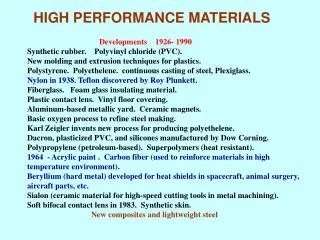
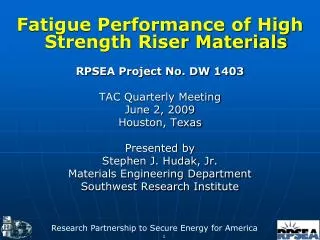
Fatigue Performance of High Strength Riser Materials RPSEA Project No. DW 1403 TAC Quarterly Meeting September 8, 2009 Houston, Texas Presented by Stephen J. Hudak, Jr. Materials Engineering Department Southwest Research Institute. Research Partnership to Secure Energy for America.

E N D
Fatigue Performance of High Strength Riser Materials RPSEA Project No. DW 1403 TAC Quarterly Meeting September 8, 2009 Houston, Texas Presented by Stephen J. Hudak, Jr. Materials Engineering Department Southwest Research Institute Research Partnership to Secure Energy for America
Project Objective • Assess the fatigue resistance of new high strength HPHT riser materials in representative environments • Fatigue Crack Growth Rates (FCGR) • Classical S-N fatigue life • Environments • Air (baseline) • Sour brine • Seawater
Materials MaterialYSSourStatus 1 114 ksi yes Specimens machined; frequency-scan tests complete; Fatigue testing underway 2 131 ksi yes Specimens machined; frequency-scan tests complete Fatigue testing underway 3 ~125 ksi yes Received material this quarter; Specimen machining complete 4 132 ksi no Specimens machined; frequency-scan tests complete; Fatigue testing underway. 5 156 ksi no Specimens machined; Frequency-scan tests complete; Fatigue testing underway 6 ~120 ksi yes Received material this quarter: S-N specs. machined
FCGR in Lab Air • FCGR testing in air complete • for four steels initially acquired • FCGR increases slightly with • increase material YS • FCGRs may also be influenced • by material microstructure • Air data provide baseline • for comparison with FCGRs • in seawater and sour brine
Frequency Response vs. YS Sour Brine Seawater Air Baseline Air Baseline
Region II Classical Freq. Effect Region I Inverse Freq Effect Background: Freq. Dependence Complex at Low DK Mod 4130 Steel: YS=98ksi Sour Environment
Inverse Freq. Effect at Low DK Due to Corrosion-Product Wedging d=1/p(Kmax/E sys)2
Initial S-N Results:114 ksi YS Material in Sour Brine X65 Weldment in sour brine trend line
Last-Quarter Progress • Procured remaining two test materials • Completed all S-N specimen machining • Completed frequency-scan tests on four steels initially acquired • Met with PWC to select optimum test frequencies • Completed air S-N testing at SwRI to assess inter-laboratory reproducibility with NETL • Initiated air S-N testing at NETL • Initiated seawater S-N testing • Initiated sour brine S-N testing • Initiated seawater FCGR testing • Initiated sour brine FCGR testing
Next-Quarter Plans • Machine several Ti-alloy FCGR specimens (CT geometry) and assess their viability in view of propensity for out-of-plane cracking in Ti alloys. • Perform frequency-scan tests on Ti-alloy in sour brine environment. • Assess effectiveness of variable-frequency S-N and FCGR testing strategy in terms of technical objectives and project schedule. • Assess inter-laboratory reproducibility of S-N air data generated at SwRI vs. NETL-Albany, Oregon.
Costs RPSEA Contract Amt $800K BP Cost Share $200K Total Contracted Amt $1,000K Costs to Date $430K Balance $570K
Question & Comments Are Always Welcome • SwRI’s RPSEA DW 1403 Project Manager Steve Hudak (210) 522-2330 shudak@swri.org • RPSEA’s DW 1403 Project Manager Jim Chitwood (713) 754-4513 JimChitwood@chevron.com • PWC Co-Chairmen Himanshu Gupta Steven Shademan (281) 366-3235 (281) 366-6171 Himanshu.gupta@bp.comSteven.Shademan@bp.com
Environments • Lab air (baseline): 70-75°F, 40-60% RH • Seawater: ASTM D1141 substitute ocean water open to the air with cathodic protection: - 1050mv vs. Saturated Calomel Electrode • Sour Brine: Production brine with oxygen below 10 ppb and 35% H2S + 65% CO2
Frequency Scan Testing Seawater • Corrosion fatigue performance sensitive to loading frequency • Fatigue crack growth rates at constant-DK used to characterize frequency effect in frequency scan (FS) tests 13x
Seawater vs. Sour Brine Seawater YS = 114 ksi Sour Brine 6X 24X
Seawater vs. Sour Brine Seawater YS = 131 ksi SourBrine 15X 250X
Material-Environment Interactions Corrosion-Fatigue Acceleration* vs. Air Baseline Yield Strength, ksi 114 131 132 Environment: Sour Brine Seawater 24X 250X --- 6X 15X 15X * At DK= 20 ksi√in. R=0.5 and Frequency = 0.01 Hz