Download

1 / 79
790 likes | 870 Views
Monitoring Nonlinear Profiles with Random Effects by Nonparametric Regression. Jyh-Jen Horng Shiau Institute of Statistics National Chiao Tung University ( 交通大學統計所 洪志真 ) Sept. 25, 2009 NCTS Industrial Statistics Research Group Seminar. Outline. Introduction Linear Profile Monitoring

E N D
Monitoring Nonlinear Profiles with Random Effects byNonparametric Regression Jyh-Jen Horng Shiau Institute of Statistics National Chiao Tung University (交通大學統計所 洪志真) Sept. 25, 2009 NCTS Industrial Statistics Research Group Seminar
Outline • Introduction • Linear Profile Monitoring • Fixed Effects vs. Random Effects • NonlinearProfile Monitoring • Parametric Regression vs. Nonparametric Regression • Fixed Effects vs. Random Effects • Phase I Monitoring • Phase II Monitoring • Examples • Conclusions
SPC: Variables vs. Profiles • Classical SPC: using one or multiple quality characteristics (a single univariate or multivariate variable) to measure the process quality. • However, in many situations, the response of interest is not a single variable but a function of one or more explanatory variables. This functional response is called a profile. • Profile Monitoring
Other Terms for Profiles • Waveform Signal (Jin and Shi, 2001) • Signature (Gardner et al., 1997) Example: Vertical Board Density Profile Data from Walker and Wright (JQT, 2002)24 profiles of vertical density, each profile consists of 314 measurements.
Profile Monitoring The objective is to monitor functional data over time. ……… response (Y) n=10 explanatory variable (X) ……… j = 2 j = k j = 1 time j = 1,2,…,k sample profiles, n>2 observations in each profile
Applications: Dissolving Process of Aspartame An example of a product characterized by a profile is aspartame, an artificial sweetener. An important characteristic of the product is the amount of aspartame that can be dissolved per liter of water at different temperatures. (Kang and Albin, 2000).
SemiconductorGateoxide Thickness Surface By Gardner et al. (1997) Fig. (a) shows the gateoxide thickness surface of a wafer that was processed under fault-freeconditions. Fig. (b) shows the gateoxide thickness surface of a wafer processed under known equipment faults. X and Y are the distances from the center of the wafer. Not only there is an apparent decrease in thickness between the two surfaces (from (a) to (b)), but also a change in spatial pattern.
Tonnage Stamping Process The figure shows the complicated profile form of a Stamping Force Profile given by Jin and Shi (1999).Different local features are needed to be monitored in each interval. Jin and Shi used the term waveformsignals to refer to profiles.
BioassayDose Response Curve A dose response curve, given by Williams, Birch, Woodall, and Ferry (2006), according to different doses and different time periods. Ith profile, jth dose, kth replication
Two Approaches • Parametric Regression • Fit a parametric model of known form to each profile • Monitor each parameter with a separate chart or • Use a multivariate chart based on the vectors of parameter estimates. • Nonparametric Regression • Smooth each profile data • Use various metrics to detect changes in profile shape.
Fixed-effect model where are independent and normally distributed with mean 0 and variance . Kang and Albin (2000) Kim, Mahmound, and Woodall (2003) Mahmound and Woodall (2004) Mahmound (2004) Linear Profile Monitoring
Kang and Albin (2000) Monitor slope and intercept jointly with multivariate chart. Treat the residuals between the sample and reference lines as a rational subgroup and monitor residuals with a combined EWMA/R chart. Phase-I statistics are dependent and thus control limits can not be determined directly from marginal distributions. Linear Profiles with Fixed-Effect Model
Kim et al. (2003) considered the same model but coded the X-values by centering so that the least square estimators of intercept and slope are independent. Linear Profiles with Fixed-Effect Model A two-sided EWMA to monitor intercept A two-sided EWMA to monitor slope A one-sided EWMA to monitor error variance
Why Random Effects? • Under the fixed-effect model, the batch effect, the change of humidity or temperature, the characteristics of the measuring equipment, etc., are all included in the error term, which may not be appropriate since these time-varying factors may affect the values of the intercept and slope of the linear profile. • By their nature, these hard-to-control factors should be considered as common causes of variations. • Should allow profile-to-profile variations.
Linear Profiles with Random Effects(Shiau, Lin, and Chen, 2006) • For the ith observation of the jth profile, assume where ~ N( , ), ~ N( , ), ~ N(0, ), , , and are mutually independent. • Let the set points be pre-coded so that where
A Simulated Example and ~N(3, 0.09), ~N(0, 1). ~N(2, 0.09) yij Xi
Since are mutually independent, set the individual are • The control limits of Phase II Method are known. • In Phase II, usually assume that • Adopt the combined-chart approach. false-alarm rate of each chart at to achieve an overall false-alarm rate at
When the Fixed-effect Model is Mistakenly Used Using the wrong model causes incredibly many false alarms! ( 92.73 % are false alarms!)
Linear Profiles with Random Effects Phase I --- Estimation • Under the random-effect model with coded xi’s, are i.i.d. are i.i.d. These statistics are mutually independent.
Phase-I Monitoring Statistics • The three monitoring statistics : where
where Bonferroni Method • profiles in the Phase I historical data set. • If we control each individual false-alarm rate at level then the overall false-alarm rate for the profiles is controlled at level • Control limits using the Bonferroni Method:
Evaluation Criteria for Phase I Methods • Main concern in evaluating Phase I methods • Effectiveness in detecting out-of-control profiles correctly. • Commonly used criterion – “signal probability” • Include both true and false alarms. • Proposed criteria • “True-alarm rate” – the rate of detecting real out-of-control profiles. • “False-alarm rate” – the rate of claiming in-control profiles out of control.
Bonferroni vs. Multiple FDR • The Multiple FDR method • An extension of FDR (False Discovery rate) • The Multiple FDR method is better than the Bonferroni method in terms of detecting power, especially when there are more out-of-control profiles in the historical data. • The tradeoff is the slightly larger false-alarm rate, but still very small (less than 0.003).
Other Related Works • Mahmoud A. Mahmoud and William H. Woodall (2004). “Phase I Analysis of Linear Profiles with Calibration Applications”. Technometrics, Nov. 2004. • Mahmoud A. Mahmoud, Peter A. Parker, William H. Woodall and Douglas M. Hawkins (2006). “A Change Point Method for Linear Profile Data”. Qual. Reliab. Engng. Int. 2006. • CHRISTINA L. STAUDHAMMER, VALERIE M. LEMAY, ROBERT A. KOZAK, and THOMAS C. MANESS (2005). ” MIXED-MODEL DEVELOPMENT FOR REAL-TIME STATISTICAL PROCESS CONTROL DATA IN WOOD PRODUCTS MANUFACTURING”. FBMIS Volume 1, 2005, 19-35. • Wang, K. and Tsung, F. (2005). “Using Profile Techniques for a data-rich Environment with Huge Sample Size”. Quality and Reliability Engineering International, 21, 7, 677-688. • WILLIS A. JENSEN, JEFFREY B. BIRCH, and WILLIAM H. WOODALL (2006). “Profile Monitoring via Linear Mixed Models” JSM 2006 Online Program.
Related Works • Jensen, W. A. Woodall, W. H, and Birch, J. B.(2003). "Phase I Monitoring of Nonlinear Profiles". • Ding, Y., Zeng, L., and Zhou, S., (2005). “Phase I Analysis for Monitoring Nonlinear Profile signals in Manufacturing Processes”, Journal of Quality Technology, 38(3), 199-216. • WILLIS A. JENSEN and JEFFREY B. BIRCH (2006). “Profile Monitoring via Nonlinear Mixed Models”. Technical Report. • J. D. Williams, J. B. Birch, W. H. Woodall, and N. M. Ferry (2006). “Statistical Monitoring of Heteroscedastic Dose-Response Profiles from High-throughput Screening”, JSM 2006 Online Program. • Shiau, J.-J. H., Yen, C.-L., and Feng, Y.-W. (2006). “A New Robust Phase I Analysis for Monitoring of Nonlinear Profiles. Technical Report.
Nonlinear Profile Monitoring via Nonparametric Regression • Fixed Effects • Random Effects
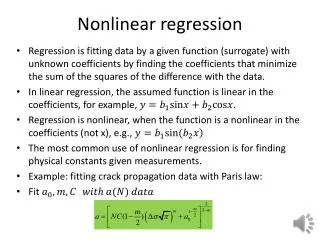
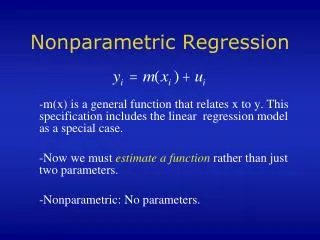
Nonparametric Regression • Consider the following nonparametric regression model: where m(x) is a smooth regression curve and ’ s are i.i.d. normal variates with mean zero and common variance . • With B-spline regression, the model is replaced by: is the unknown B-spline coefficient of the lth B-spline basis to be estimated from data. • Estimate by
Nonparametric Fixed-Effect ModelShiau and Weng (2004) • Simulated example: where are fixed constants. • Apply B-spline regression to each sample profile. • Monitor mean shiftsEWMA chart • The EWMA statistic of the jth profile with smoothing constant :
Nonparametric Fixed Effect Model • Monitor variation change R chart The R statistic of the jth profile (use range) : • Another chart for variation change EWMSD where where The EWMSD statistic: where where . . where . .
Fixed vs. Random Effects • Fixed-effect model • No profile-to-profile (subject-to-subject) variation • The function is a fixed function, same for each profile. • Random-effect model • There exists profile-to-profile variation caused by common causes. • The profile function is a random function. • Profiles are modeled as realizations of a stochastic process with a mean curve and a covariance function.
Nonparametric Random-Effect Model • Shiau, J.-J. H., Huang, H.-L., Lin, S.-H., and Tsai, M.-Y. (2009). “Monitoring Nonlinear Profiles with Random Effects by Nonparametric Regression”. Communications in Statistics-Theory and Methods. 38, 1664-1679.
Nonparametric Random-Effect Model • Adopt the random-effect model to provide more variability we often observe in many profile data. • Motivated example: aspartame • Original model to generate aspartame profiles: where i.i.d. i.i.d. Random Variables ! Represent common-cause variations among profiles. i.i.d. i.i.d.
Problems with the Original Model • Not Gaussian • Covariance matrix depends on • Too complicated to analyze
Stochastic Gaussian Process Model • Gaussian process with • Mean function • Covariance function • In-control process
Out-of-control Process • When the mean function is shifted, say,
Data Smoothing • Preprocessing: Smooth each profile. • Smoothing splines or B-spline regression • Other smoothing techniques: kernel smoothing, local polynomial smoothing, wavelets • After sample profiles are de-noised (i.e., to eliminate the effects of ), we have the smoothed profiles : • represents the profile-to-profile variations
Principal Component Analysis (PCA) • Method: Apply principal component analysis (PCA) on to obtain the principal modes of variations • PCA is to find an orthogonal matrix such that • Eigen-analysis • Eigenvectors are principal components
Phase I Monitoring (1) • A set of historical profiles is available • Smooth each profile • Apply PCA to sample covariance matrix • Eigenvectors are principal components (PC) • PC-score
Phase I Monitoring (2) • Select “effective” principal components by • Total variation explained • Choose the first K such that reaches a desired level • Parsimoniousness • Score vector of the th profile
Phase I Monitoring (3) • Hotelling statistics • The usual sample mean and sample covariance matrix of the score vectors
Phase I Monitoring (4) • Since score vectors are asymptotically multivariate normal, we have • upper control limit of chart:
Phase I Monitoring (5) • Note that the monitoring statistics across curves in Phase-I are not independent. So the prescribed overall false-alarm rate cannot be achieved by the marginal distribution of the monitoring statistics. • We can adopt the Bonferroni approach to control the overall false-alarm rate (i.e., type I error) at level .
Phase II Monitoring (1) • In Phase II, we usually assume that is known. • In practice, is estimated by the sample covariance matrix of Phase-I in-control profiles. • Apply PCA to to obtain eigenvalues and eigenvectors • Choose K effective PCs
Phase II Monitoring (2) • Now for the new incoming profile • First smooth then project it onto the K PCs to obtain K independent PC-scores: • If the process is in control
Individual PC-score Charts • rth PC-score chart • Monitoring Statistic: • Control limits:
A Combined Chart • Signals when any of the K individual chartssignals • Equivalent to monitoring the statistic: • Control limits: where individual false alarm rate is set at so that overall false alarm rate is