Download
1 / 1

E N D
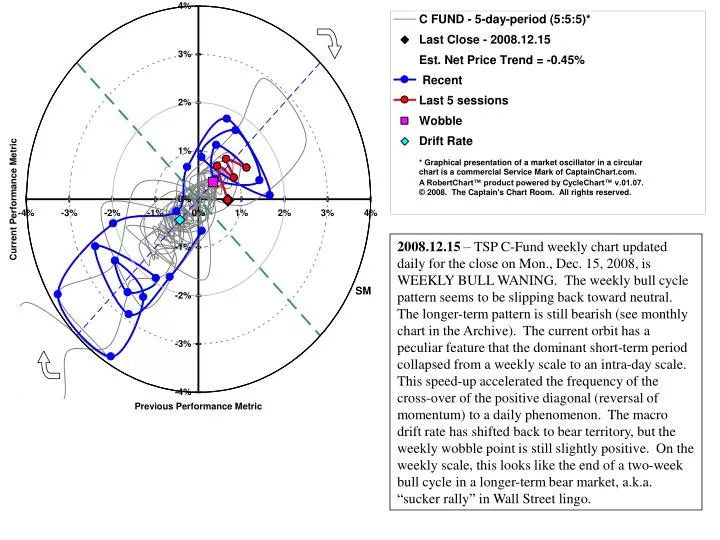
2008.12.15 – TSP C-Fund weekly chart updated daily for the close on Mon., Dec. 15, 2008, is WEEKLY BULL WANING. The weekly bull cycle pattern seems to be slipping back toward neutral. The longer-term pattern is still bearish (see monthly chart in the Archive). The current orbit has a peculiar feature that the dominant short-term period collapsed from a weekly scale to an intra-day scale. This speed-up accelerated the frequency of the cross-over of the positive diagonal (reversal of momentum) to a daily phenomenon. The macro drift rate has shifted back to bear territory, but the weekly wobble point is still slightly positive. On the weekly scale, this looks like the end of a two-week bull cycle in a longer-term bear market, a.k.a. “sucker rally” in Wall Street lingo.