Download
1 / 27
270 likes | 390 Views
Open Society Forum Initiative for Policy Dialogue Press Institute of Mongolia. POVERTY REDUCTION: From rhetoric to reality Isabel Ortiz. Covering Economic Development Ulanbataar, July 5-7 2005. Session Objectives. Understanding poverty and inequality measurements Background poverty

E N D
Open Society Forum Initiative for Policy Dialogue Press Institute of Mongolia POVERTY REDUCTION: From rhetoric to reality Isabel Ortiz Covering Economic Development Ulanbataar, July 5-7 2005
Session Objectives • Understanding poverty and inequality measurements • Background poverty • Key elements of poverty reduction strategies • Budgets: • Pro poor budgets/expenditures - 3 levels: • Horizontal – Inter and intra sector budget allocations • Vertical – Decentralization • Time – Multiannual budgets – MTEFs = Things to watch out
Poverty Trends • Poor People Below $2 a day Poverty Line • 1990 2000 2015 • In Millions • East Asia and the Pacific 1,094 873 354 • South Asia 971 1052 968 • Europe and Central Asia 31 101 48 • Latin America 121 136 124 • Middle East N. Africa 50 72 38 • Sub-Saharan Africa 386 504612 • Total 2,6532,737 2,144 • In % • East Asia and the Pacific 68.5 48.3 18.2 • South Asia 86.3 77.7 59.2 • Europe and Central Asia 6.8 21.3 10.3 • Latin America 27.6 26.3 20.5 • Middle East N. Africa 21.0 24.4 10.2 • Sub-Saharan Africa 76.0 76.5 70.7 • Total 60.8 53.6 36.4 • Source: World Bank, 2004, Global Economic Prospects.
Poverty Trends • 2.8 billion people (half the world's population) live below the international poverty line of US$2 a day. • 1.2 billion people live in extreme poverty, surviving on less than $1 a day • Most of the poor are in Asia and Africa • The incidence of poverty is larger in women than men and higher in rural areas than in urban areas. • Vulnerable groups such as the elderly, ethnic minorities, refugees or the disabled are much more affected by poverty • Since 1987, the incidence of poverty has decreased, and the proportion of people living below the 2 dollar-a-day poverty line declined • However, in absolute terms, poverty is not decreasing. Population growth remains high in developing countries, and many are born in poverty and destitution. Using World Bank's data, the number of poor people has actually increased since 1990.
Poverty: Definition and Measurements • Highly political issue. Governments tend to hide the existence of poverty as it makes them look underdeveloped and shows public policy failures. • Different countries use different methodologies • = Difficult comparisons • Often based on the per capita expenditure necessary to attain 2000-2500 calories per day, plus a small allowance for non-food consumption • BUT: It is not the same 2500 cals. of a balanced diet including quality protein than 2500 cals. of fried flour=> 2 different poverty lines (the 2nd one cheaper = shows less number people poor) !! • Poverty measures do not adequately reflect other expenses necessary to cover basic needs - clothing, drinking water, housing, access to basic education and health, among others • United Nations institutions started using the $1 and $2 dollar-a-day pov lines • World Bank developing LSMS in most countries – best account of poverty but difficult to compare • => If measurements based on a real minimum consumption basket were used, the number of people living in poverty would soar.
Beware of statistics . These 2 graphics say the same... but can be interpreted very differently!! GOVERNMENT POLICIES FAIL!! GOVERNMENT POLICIES SUCCESS!! Darrell Huff: How to lie with Statistics
Poverty =/= Inequality • Inequality shows the distribution of income, consumption and other welfare indicators in society("who gets what") – different socioeconomic groups (Quintiles = Q1 -20% poorest; Q5 -20% richest) • Comparing what the rich and the poor have => politically sensitive • Quality of data even worse than poverty indicators • "MICKY MOUSE NUMBERS" • Egypt and Bangladesh are "officially" more equal societies than Australia or France!
Poverty in Perspective • Poverty is not a new phenomenon (ie. Europe in the 19th century – Dickens, Engels descriptions = similar to poverty/shanty towns in developing countries) • The lesson is that poverty can be reduced if governments are committed - and it can be reduced relatively quickly. • Example– Post 2 World War OECD policies, based on: • Full employment • Macroeconomic stability • Government involvement in education, medical care, social security and housing assistance, employment policies, enforcement of labor laws and regulations • Postwar policies allowed high productivity gains in the workforce, expanded domestic demand, and increased economic growth • The populations of Europe, Japan, North America, Australia and New Zealand experienced a prosperity unseen in history
So... Why not in Developing Countries? • Government commitment is rare - poverty reduction is generally only one of many developmental objectives • A significant amount of developing countries are starved of capital, pressured by external debt • Developing countries have limited access to developed countries markets to export their products • Social development has not been a priority; it been largely neglected, or at best addressed with inadequate resources, and people are left uneducated, without support • Public policy-making often captured by some interest groups who benefit disproportionately from public policies, instead of ensuring development for the majority of the population • Corruption, nepotism, negligence, mismanagement, damage the poor the most • Anti-poverty plans are often underbudgeted, have no target objectives or deadlines => PRSPs very positive step
Key elements of Poverty Reduction Strategies I • How to prepare a Poverty Reduction Strategy? • Diagnoses of who is poor • Causes of poverty • Obstacles to reduce poverty • => Strategy/priorities to fight poverty • Budget • Institutional implementation arrangements • Monitoring mechanisms including a comparable poverty line • 3 Key elements (World Bank 2001: Attacking Poverty) 1. Extend Opportunities to the Poor 1.a. Economic growth. Two options: • Employment generating growth – preferred because labor absorption • Or not – if not, can be taxed to finance poverty reduction programs • Vinod Thomas: The Quality of Growth, WB
Key elements of Poverty Reduction Strategies II 1.b Extend Opportunities to the Poor • physical assets - infrastructure from which the poor benefit directly, such as water and sanitation • natural assets - through policies such as land reform • financial assets - access to credit • human assets - investing in social sectors to ensure access to health and education, skills and training. • Empowerment Equality in governance issues: • efficient, accountable, transparent, and responsive public administrations, with a mandate and capacity for pro-poor interventions; • legal systems that are equitable and accessible to the poor; • decentralized mechanisms for broad-based participation in the delivery of public services and efforts to minimize the likelihood of these services being captured by local elites; and • a climate in which poor people’s organizations can flourish, so they become more self-reliant, and in which the poor can take part in the political process. If good governance was enforced in public administrations, PRSPs would not be necessary
Key elements of Poverty Reduction Strategies III • 3. Reducing Risks and Vulnerability • Risk – the dynamic concept of poverty • People not static (poor or not all the time), they face risks that plunge them • into poverty • life cycle risks to the individual - illness, injury, disability, old age • economic risks such as unemployment, crisis, economic transition and restructuring, harvest failure; • environmental risks such as natural catastrophes and disasters; • development-induced risks, such as through involuntary displacement and its associated risks of landlessness, job loss, homelessness and marginalization, etc A combination of public investments in social insurance, safety nets, disaster prevention/mitigation programs, and emergency relief are essential to provide security to the poor and vulnerable groups.
Budgets and Poverty Reduction • All governments do something to reduce poverty – the problem is: HOW MUCH? • => Need to distinguish between rhetoric and reality: Budgets reflect best the real priorities of a government • Governments finance a large amount of activities but in developing countries effectivity tends to be low • Example:Social sector investments: Ministries of Education, Health and Social Security/Welfare exist everywhere. However, they often fail to ensure services to the poor due to: • limited coverage, serving only a portion of the population, often the wealthiest segments of society instead of the poor (health and pensions being recurrent cases), and more males than females (i.e. education) • insufficient funds, incorrectly distributed among programs - typical examples are national programs subsidizing universities that benefit upper urban income groups instead of basic education for the poor, or large cardiology hospitals in the capital instead of health clinics in villages. • Development needs are infinite but resources limited. Two options: • To reduce less important expenditures,from a public point of view • To increase resources • => Need to properly balance needs and resources => to PRIORITIZE INTRA e INTER sector expenditures
Sources of Funds for a Government • Taxation • Direct taxes (progressive* - transfer from the wealthy to the poor) • Indirect taxes (ie. VAT – more resources but regressive*) • => Need to fight tax evasion • Funds resulting from privatization of public assets • External financing • Development assistance • External debt (caution!) • Printing currency => inflation (caution!!) *Any policy has different distribution impacts! Policies can be: Progresive: if a policy benefits more the poor and lower income groups Regressive: if a policy benefits more the wealthy and upper income groups
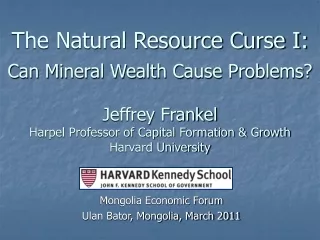
Expenditures and Poverty: Pro-poor budgets • Who benefits most from public expenditures? Is spending progressive, "pro • poor" ? Or is it sustaining administrative structures or vested interests? Are key • sectoral programs (agriculture, infrastructure, education, health, pensions, etc) • working to reduce poverty? • There are several instruments that measure the adequacy of programs to serve • the poor, most significantly: • Public policy analysis -- attending to issues of • Coverage • Distribution • Adequacy of benefits/services • Sustainability • Efficiency • Management and institutional arrangements • Auditing of public expenditures. • Incidence benefit analysis -- focusing on equity issues (who receives how much?), presenting the distribution of expenditures • by socio-economic group (quintiles - 20% richest to 20% poorest) • by geographical area (X to Z region) etc
. Source: Inter American Development Bank, 1999
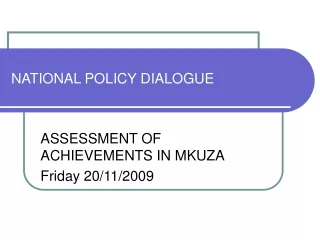
. Source: Inter American Development Bank, 1999
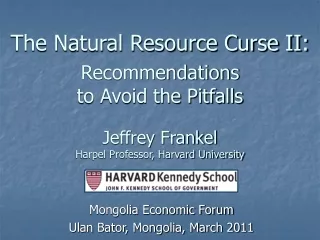
. Source: Inter American Development Bank, 1999
Pro-poor expenditures • Pro-poor budgets are those that benefit the population near or below the poverty line, disproportionally to other non-poor socio-economic groups (=progressive) • Public policy and incidence benefit analyses developed around the world for • a variety of public services evidence that, generally, the following are pro • poor expenditures: • Education: Primary education and, to a lesser degree, secondary education. • Health: Preventive, primary health; child and mother care. • Infrastructure: rural electrification, water and sanitation, rural roads. • Social Protection: If correctly designed, all social security/welfare programs except private pensions • Decentralization, if good governance at the local level, and if proper equalization formulas exist between regions • Rural development programs targeted to the poor • Urban development focused on marginal areas (shanty towns)
Regressive, not-propoor expenditures • Alter alia, the following expenditures do not benefit directly the poor: • Education: University/tertiary education • Health: Urban hospitals far from urban marginal areas, specialized clinics (cardiology etc.) • Infrastructure: Large infrastructure projects—dams, motorways, airports • Social Protection: Private pensions, public pensions where the informal sector is large • Subsidies to public and private enterprises (except small and micro enterprises) • Financial sector reform/rescue, transfers to banks • Defense/military expenditures
Making choices: Questioning the rationale for Government funding • Does Gov't need to finance a program? In full? • Who benefits? Who is not benefiting, is there a coverage gap? • How are budget decisions done? Are allocations in accordance with national strategies (ie. PRSP)? Or are they maintaining institutional structures? • Participatory Budgeting • When people are asked => Budgets look very different • Participatory budgeting -- Process in which a wide range of stakeholders debate, analyse, prioritise and monitor decisions about public expenditures and investments’ The case of Porto Alegre – Deindustrialized city in Brazil • Workers Party at the municipal government (1989- ) started participatory budgeting. Highly successful model. From 1989 to 1996 (only 7 years!); - No. homes with access to water supply increased from 80% to 98% - No. homes with access to sanitation - 46% to 85% - No. children going to school – 100% increase • 80 cities in Brasil following model + leftist municipalities in Europe.
Vertical level: Decentralization Paliament/PM Office • How to make expenditures reach the local level, populations? • Poverty is fundamentaly a rural phenomenon • Regional/equalization transfers => mecanism to reduce poverty • To decentralize: • Local goventments need capacity • Local governments accountable • National strategic priorities must be clear and fully shared • Clear division of responsibilities • Caution with bad decentralization! . Ministry of Finance Sector Ministries Regional Government A Regional Gov't B C Delegations Ministries Local Governments: Districts, Villages
Medium Term Expenditure Frameworks (MTEF) • How are decisions on budget allocations taken???? • MTEF is an medium-term instrument (3 to 5 years) that combines • strategic priorities with budgets in a decision-making process • STRATEGIES • priorities realism • EXPENDITURES • Good instrument to encourage transparency and rational allocation of resources • MTEFs should ensure that poverty reducing priorities are effectively translated into multi-annual budgets and thus public expenditures are progressive/pro-poor. • Most OECD countries use MTEFs • Pressured by donors, many developing countries have initiated MTEFs => Conditionality of new instruments • MTEF involves a radical change in the business of budgeting -- without political commitment, it has little chance of succeeding
Medium Term Expenditure Frameworks (MTEF): More steps Having a National Strategy (= PRSP) Verify available resources (3-5 year projections) (Ministry of Finance) Establish indicative limits to expenditure Allocate resources according to priorities Sector Ministries ellaborate detailed sector strategies and budgets, including expected target results Present it to the Ministry of Finance Ministry of Finance consolidates Presents to parliaments/National Authority Yearly revision and actualization: Estimates must be revised annual to reflect inflation, increse/decrease national resources, improvements in strategies etc
Education budget Year 1 MTEF Process National Strategy/PRSP Ministry of Finance consolidates all sectors . Approval by Parliament/Authority if consistent with national strategic priorities Educat Y3 Education Y2 Sector Ministry
Things to watch out: • How is a poverty line calculated? Is it realistic? • Who benefits most from public expenditures? • Is spending progressive? Or is spending centered on sustaining administrative structures (ie. salaries) or vested interests (ie. influential groups/elites)? • Are key sectoral programs (agriculture, infrastructure, education, health, social security, etc) working to reduce poverty? • Who/which subprograms receive the largest funding? • Is this at national or decentralized level? Are expenditures reaching the poorest regions? • Is the government using MTEF? Are expenditures allocated according with national priorities? Are strategies saying "the right things" supported by adequate resources?