Download
1 / 11
110 likes | 232 Views
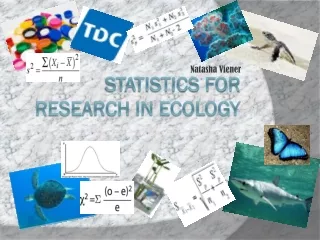
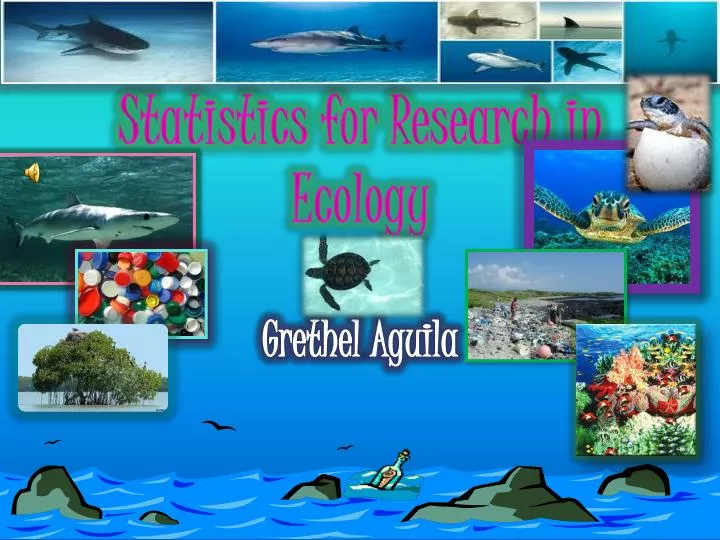
Statistics for Research in Ecology . Grethel Aguila. Lesson 1: Shark Graph. Average Size of Sharp Nosed Sharks . Lesson 2: Sea Turtle Graph . Lesson 3 : Bottle Cap Graph . Lesson 4: Sea Cigars Graph . Lesson 5: Coral Reef .

E N D
Statistics for Research in Ecology GrethelAguila
Lesson 1: Shark Graph Average Size of Sharp Nosed Sharks
Lesson 5: Coral Reef • Probabilityis a way to measure the chances that something will occur in relation to the possible alternatives. • Coral Reefs are sensitive and delicate so they can get harmed easily. Here are ways they can be damaged. • Ocean warming is when the temperatures get around 74°F/23°C and 84°F/ 29°C. Which can also cause Coral Bleaching. • Pollution is a big problem in the world. Not only do they hurt the ocean but it also damages the coral reefs. For example, some factories dump liquids into the ocean and it damages the coral reefs. • Carless Tourism is also another major issue . Thousands of tourist go to the Florida Keys each year and scuba dive to see the coral but what they don’t know is that they can also hurt them. For example , humans can transfer some types of germs, bacteria, and even diseases if they touch reefs. • Many people collect coral to sell it and this is illegal. This is Coral Mining and is also another way that the corals are ruined.
Lesson 6 : Variance • Variance is used in Statistics to describe how far away your data is from the mean. • Mean is to find an average of a set of numbers.
Lesson 7: Theoretical Distribution • ATheoretical Distribution Curve (aka TDC) is a theoretical or ideal picture of a distribution based upon random sampling.
Lesson 8: T-test • A t-testis designed to test whether there is a significant difference between the treatment control. The t-test is one of the most used statistical test in science. • If the probability is larger than the one from the table the null hypothesis is rejected. If the probability is less than the one from the table then, null hypothesis cannot be rejected. • The probability must be less than 0.05 • The T-test equation is very complex and requires a lot of work in order to get the probability. • T-test contains: Mean, Variance, Probability, and Degrees of Freedom .
Lesson 9: Chi- Test • According to Chi Square Test, p=0.001545. Since p is less than 0.5, we reject the null hypothesis, and accept the alternative hypothesis. Therefore, there is a significant difference in survival rates and between beach sites. • In order to get this data, we played a sea turtle game and recorded how many turtles live and how many died. Then we plugged in the numbers into the Chi test formula:. • Hatchlings face many dangers. They can be harmed by predators and even humans and their activities. A dirty beach can also kill hatchlings. On the dirty beach, they can face many obstacles. Our debris can end up on the beach and be difficult for a sea turtle to get to the ocean. Some people try to help out by cleaning beaches and protecting the turtles nests.
Butterfly Table • We cannot reject the null hypothesis because there is no difference. The t-test gave us 0.268386 6/21/12