Download

1 / 106
1.07k likes | 1.31k Views
NONPARAMETRIK. NON PARAMETRIC TEST. The majority of hypothesis tests discussed so far have made inferences about population parameters, such as the mean and the proportion. These parametric tests have used the parametric statistics of samples that came from the population being tested.

E N D
NON PARAMETRIC TEST The majority of hypothesis tests discussed so far have made inferences about population parameters, such as the mean and the proportion. These parametric tests have used the parametric statistics of samples that came from the population being tested. To formulate these tests, we made restrictive assumptions about the populations from which we drew our samples. For example, we assumed that our samples either were large or came from normally distributed populations. But populations are not always normal. SWN SCIENCE DEPARTMENT
And even if a goodness-of-fit test indicates that a population is approximately normal. We cannot always be sure we’re right, because the test is not 100 percent reliable. Fortunately, in recent times statisticians have develops useful techniques that do not make restrictive assumption about the shape of population distribution. These are known as distribution – free or, more commonly, nonparametric test. Non parametric statistical procedures in preference to their parametric counterparts. The hypotheses of a nonparametric test are concerned with something other than the value of a population parameter. A large number of these tests exist, but this section will examine only a few of the better known and more widely used ones : SWN SCIENCE DEPARTMENT
SIGN TEST WILCOXON SIGNED RANK TEST MANN – WHITNEY TEST (WILCOXON RANK SUM TEST) NON PARAMETRIC TESTS RUN TEST KRUSKAL – WALLIS TEST KOLMOGOROV – SMIRNOV TEST LILLIEFORS TEST SWN SCIENCE DEPARTMENT
THE SIGN TEST The sign test is used to test hypotheses about the median of a continuous distribution. The median of a distribution is a value of the random variable X such that the probability is 0,5 that an observed value of X is less than or equal to the median, and the probability is 0,5 that an observed value of X is greater than or equal to the median. That is, Since the normal distribution is symmetric, the mean of a normal distribution equals the median. Therefore, the sign test can be used to test hypotheses about the mean of a normal distribution. SWN SCIENCE DEPARTMENT
Let X denote a continuous random variable with median and letdenote a random sample of size n from the population of interest. If denoted the hypothesized value of the populationmedian, then the usual forms of the hypothesis to be tested can be stated as follows : VERSUS (right-tailed test) (left-tailed test) (two-tailed test) SWN SCIENCE DEPARTMENT
Form the differences : Now if the null hypothesis is true, any difference is equally likely to be positive or negative. An appropriate test statistic is the number of these differences that are positive, say . Therefore, to test the null hypothesis we are really testing that the number of plus signs is a value of a Binomial random variable that has the parameter p = 0,5 . A p-value for the observed number of plus signs can be calculated directly from the Binomial distribution. Thus, if the computed p-value. is less than or equal to some preselected significance level α , we will reject and conclude is true. SWN SCIENCE DEPARTMENT
To test the other one-sided hypothesis, vs is less than or equal α,we will reject . The two-sided alternative may also be tested. If the hypotheses are: vs p-value is : SWN SCIENCE DEPARTMENT
It is also possible to construct a table of critical value for the sign test. As before, let denote the number of the differences that are positive and let denote the number of the differences that are negative. Let , table of critical values for the sign test that ensure that If the observed value of the test-statistic , the the null hypothesis should be reject and accepted SWN SCIENCE DEPARTMENT
If the alternative is , then reject if . If the alternative is , then reject if . The level of significance of a one-sided test is one-half the value for a two-sided test. SWN SCIENCE DEPARTMENT
TIES in the SIGN TEST Since the underlying population is assumed to be continuous, there is a zero probability that we will find a “tie” , that is , a value of exactly equal to . When ties occur, they should be set aside and the sign test applied to the remaining data. SWN SCIENCE DEPARTMENT
THE NORMAL APPROXIMATION When , the Binomial distribution is well approximated by a normal distribution when n is at least 10. Thus, since the mean of the Binomial is and the variance is , the distribution of is approximately normal with mean 0,5n and variance 0,25n whenever n is moderately large. Therefore, in these cases the null hypothesis can be tested using the statistic : SWN SCIENCE DEPARTMENT
Critical Regions/Rejection Regions for α-level tests versus are given in this table : CRITICAL/REJECTION REGIONS FOR SWN SCIENCE DEPARTMENT
THE WILCOXON SIGNED-RANK TEST The sign test makes use only of the plus and minus signs of the differences between the observations and the median (the plus and minus signs of the differences between the observations in the paired case). Frank Wilcoxon devised a test procedure that uses both direction (sign) and magnitude. This procedure, now called the Wilcoxonsigned-rank test. The Wilcoxon signed-rank test applies to the case of the symmetric continuous distributions. Under these assumptions, the mean equals the median. SWN SCIENCE DEPARTMENT
Description of the test : We are interested in testing, versus SWN SCIENCE DEPARTMENT
Assume that is a random sample from a continuous and symmetric distribution with mean/median : . Compute the differences , i = 1, 2, … n Rank the absolute differences , and then give the ranks the signs of their corresponding differences. Let be the sum of the positive ranks, and be the absolute value of the sum of the negative ranks, and let . Critical values of , say . 1. If , then value of the statistic , reject 2. If , reject if 3. If , reject if SWN SCIENCE DEPARTMENT
LARGE SAMPLE APPROXIMATION If the sample size is moderately large (n>20), then it can be shown that or has approximately a normal distribution with mean and variance Therefore, a test of can be based on the statistic SWN SCIENCE DEPARTMENT
Wilcoxon Signed-Rank Test Test statistic : Theorem : The probability distribution of when is true, which is based on a random sample of size n, satisfies : SWN SCIENCE DEPARTMENT
Proof : Let if , then where For a given , the discrepancy has a 50 : 50 chance being “+” or “-”. Hence, where SWN SCIENCE DEPARTMENT
PAIRED OBSERVATIONS The Wilcoxon signed-rank test can be applied to paired data. Let ( ) , j = 1,2, …n be a collection of paired observations from two continuous distributions that differ only with respect to their means. The distribution of the differences is continuous and symmetric. The null hypothesis is : , which is equivalent to .To use the Wilcoxon signed-rank test, the differences are first ranked in ascending order of their absolute values, and then the ranks are given the signs of the differences. SWN SCIENCE DEPARTMENT
Let be the sum of the positive ranks and be the absolute value of the sum of the negative ranks, and . If the observed value , then is rejected and accepted. If , then reject , if If , reject , if SWN SCIENCE DEPARTMENT
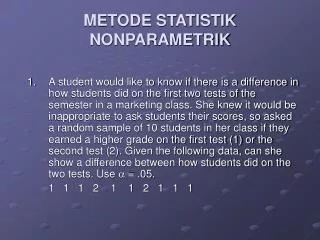
EXAMPLE Eleven students were randomly selected from a large statistics class, and their numerical grades on two successive examinations were recorded. Use the Wilcoxon signed rank test to determine whether the second test was more difficult than the first. Use α = 0,1. SWN SCIENCE DEPARTMENT
solution : Jumlah ranks positif : TOLAK H0 0 1,28 1,69 SWN SCIENCE DEPARTMENT
EXAMPLE Ten newly married couples were randomly selected, and each husband and wife were independently asked the question of how many children they would like to have. The following information was obtained. Using the sign test, is test reason to believe that wives want fewer children than husbands? Assume a maximum size of type I error of 0,05 SWN SCIENCE DEPARTMENT
SOLUSI Tetapkandulu H0dan H1 : H0 : p = 0,5 vs H1 : p < 0,5 Adatigatanda +. Di bawah H0 , S ~ BIN (9 , 1/2) P(S ≤ 3) = 0,2539 Padaperingkatα = 0,05 , karena 0,2539 > 0,05 maka H0janganditolak. SWN SCIENCE DEPARTMENT
THE WILCOXON RANK-SUM TEST Suppose that we have two independent continuous populations X1 and X2 with means µ1 and µ2. Assume that the distributions of X1 and X2 have the same shape and spread, and differ only (possibly) in their means. The Wilcoxon rank-sum test can be used to test the hypothesis H0 : µ1 = µ2. This procedure is sometimes called the Mann-Whitney test or Mann-Whitney U Test. SWN SCIENCE DEPARTMENT
Description of the Test Let and be two independent random samples of sizes from the continuous populations X1 and X2. We wish to test the hypotheses : H0 : µ1 = µ2 versus H1 : µ1 ≠ µ2 The test procedure is as follows. Arrange all n1 + n2observations in ascending order of magnitude and assign ranks to them. If two or more observations are tied, then use the mean of the ranks that would have been assigned if the observations differed. SWN SCIENCE DEPARTMENT
Let W1 be the sum of the ranks in the smaller sample (1), and define W2to be the sum of the ranks in the other sample. Then, Now if the sample means do not differ, we will expect the sum of the ranks to be nearly equal for both samples after adjusting for the difference in sample size. Consequently, if the sum of the ranks differ greatly, we will conclude that the means are not equal. Refer to table with the appropriate sample sizes n1 and n2 , the critical value wα can be obtained. SWN SCIENCE DEPARTMENT
H0 : µ1 = µ2is rejected, if either of the observed values w1 or w2 is less than or equal wα If H1 : µ1 < µ2,then reject H0 if w1 ≤ wα For H1 : µ1 > µ2, reject H0 if w2 ≤ wα. SWN SCIENCE DEPARTMENT
LARGE-SAMPLE APPROXIMATION When both n1 and n2 are moderately large, say, greater than 8, the distribution of W1can be well approximated by the normal distribution with mean : and variance : SWN SCIENCE DEPARTMENT
Therefore, for n1 and n2 > 8, we could use : as a statistic, and critical region is : • two-tailed test • upper-tail test • lower-tail test SWN SCIENCE DEPARTMENT
EXAMPLE A large corporation is suspected of sex-discrimination in the salaries of its employees. From employees with similar responsibilities and work experience, 12 male and 12 female employees were randomly selected ; their annual salaries in thousands of dollars are as follows : Is there reason to believe that there random samples come from populations with different distributions ? Use α = 0,05 SWN SCIENCE DEPARTMENT
SOLUSI H0 : f1(x) = f2(x) APA ARTINYA?? random samples berasaldari populasidengandistribusi yang sama H1 : f1(x) ≠ f2(x) Gabungkandanbuatperingkat salaries : SWN SCIENCE DEPARTMENT
C........ SWN SCIENCE DEPARTMENT
Andaikan, kitapilihsampeldari female, makajumlahperingkatnya R1 = RF = 117 Statistic nilaidari statistic U adalah SWN SCIENCE DEPARTMENT
Grafik α = 0,05 Zhit= 1,91 makaterima H0 -1,96 1,96 ARTINYA ??? SWN SCIENCE DEPARTMENT
KOLMOGOROV – SMIRNOV TEST The Kolmogorov-Smirnov Test (K-S) test is conducted by the comparing the hypothesized and sample cumulative distribution function. A cumulative distribution function is defined as : and the sample cumulative distribution function, S(x), is defined as the proportion of sample values that are less than or equal to x. The K-S test should be used instead of the to determine if a sample is from a specified continuous distribution. To illustrate how S(x) is computed, suppose we have the following 10 observations : 110, 89, 102, 80, 93, 121, 108, 97, 105, 103. SWN SCIENCE DEPARTMENT
We begin by placing the values of x in ascending order, as follows : 80, 89, 93, 97, 102, 103, 105, 108, 110, 121. Because x = 80 is the smallest of the 10 values, the proportion of values of x that are less than or equal to 80 is : S(80) = 0,1. SWN SCIENCE DEPARTMENT
The test statistic D is the maximum- absolute difference between the two cdf’s over all observed values. The range on D is 0 ≤ D ≤ 1, and the formula is : where x = each observed value S(x) = observed cdf at x F(x) = hypothesized cdf at x SWN SCIENCE DEPARTMENT
Let X(1) , X(2) , …. , X(n) denote the ordered observations of a random sample of size n, and define the sample cdf as : is the proportion of the number of sample values less than or equal to x. SWN SCIENCE DEPARTMENT
The Kolmogorov – Smirnov statistic, is defined to be : For the size αof type I error, the critical region is of form : SWN SCIENCE DEPARTMENT
EXAMPLE 1 A state vehicle inspection station has been designed so that inspection time follows a uniform distribution with limits of 10 and 15 minutes. A sample of 10 duration times during low and peak traffic conditions was taken. Use the K-S test with α = 0,05 to determine if the sample is from this uniform distribution. The time are : 11,3 10,4 9,8 12,6 14,8 13,0 14,3 13,3 11,5 13,6 SWN SCIENCE DEPARTMENT
SOLUTION • H0 : sampelberasaldaridistribusi Uniform (10,15) versus H1 : sampeltidakberasaldaridistribusi Uniform (10,15) • Fungsidistribusikumulatifdarisampel : S (x) dihitungdari, SWN SCIENCE DEPARTMENT
HasilPerhitungandari K-S SWN SCIENCE DEPARTMENT
, untuk x = 10,4 Dalamtabel , n = 10 , α = 0,05 D10,0.05 = 0,41 f(D) α = P(D ≥ D0) D0 D 0,12 < 0,41 maka do not reject H0 SWN SCIENCE DEPARTMENT
EXAMPLE 2 Suppose we have the following ten observations 110, 89, 102, 80, 93, 121, 108, 97, 105, 103 ; were drawn from a normal distribution, with mean µ = 100 and standard-deviation σ = 10. Our hypotheses for this test are H0 : Data were drawn from a normal distribution, with µ = 100and σ = 10. versus H1 : Data were not drawn from a normal distribution, with µ = 100and σ = 10. SWN SCIENCE DEPARTMENT
SOLUTION F(x) = P(X ≤ x) SWN SCIENCE DEPARTMENT