Download
1 / 12
130 likes | 249 Views
Node-Attribute Graph Layout for Small-World Networks. Helen Gibson. Principal Supervisor: Dr. Paul Vickers 1 st Supervisor: Dr. Maia Angelova 2 nd Supervisor: Dr. Fouad Khelifi Previous Supervisor: Dr. Joe Faith. What is a Graph?. Relationships between concepts.

E N D
Node-Attribute Graph Layout for Small-World Networks Helen Gibson Principal Supervisor: Dr. Paul Vickers 1st Supervisor: Dr. Maia Angelova 2nd Supervisor: Dr.FouadKhelifi Previous Supervisor: Dr. Joe Faith
What is a Graph? Relationships between concepts Mathematics and Graph Theory Information Visualisation Graph Drawing Network Visualisation Network Graph
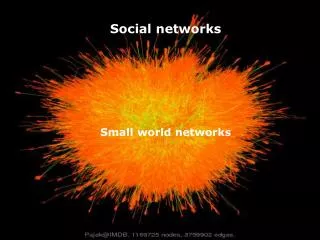
Examples Social Networks http://on.fb.me/hy6dmb World Wide Web http://datamining.typepad.com/gallery/blog-map-gallery.html Biological Networks http://circos.ca IP Addresses https://www.fractalus.com/steve/stuff/ipmap/ http://visualcomplexity.com
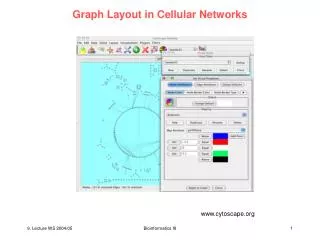
What’s the Problem? It looks nice but is it doing anything useful? Typical complaint: Giant-Hairball Caused by force-directed algorithms Old, but still popular and most commonly used Connected nodes attract, other repel Yeast interaction network in Gephi
How Can This Be Solved? Node Attributes Example – Social Network Node = People Links = Friendships Attributes = age, gender, location, games they interact with, pages they had liked etc. Typical Usage – As retinal variables Use to tell us more information about the graph Uses beyond retinal variables?
Research Aims Novel graph layout based on node-attributes Many node attributes -> use a dimension reduction technique Visual analysis of graphs Visual Analytics - the science of analytical reasoning facilitated by interactive visual interfaces. [Thomas and Cook, 2005] To further understand the connectivity and structure of the graph
Node-Attributes to Dimensions Attributes as a second set of links Nodes Attributes Each attribute node is a dimension and existence of a link is a value for that dimension on that node
Dimension Reduction and TPP In visualisation: • Many variables form a high-dimensional space reduce to 2 or 3 dimensions that can be seen on a display. • Linear projections Projection Pursuit: • Finds the most ‘interesting’ projection • Interestingness depends on the data Targeted Projection Pursuit (TPP): • Interactive • Searches for a projection closest to a users desired view • In following case, separation of the clusters as far as possible.
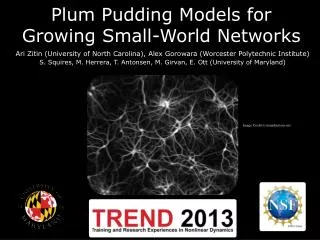
Small-World Networks Networks that are: • Highly clustered • Smaller than average shortest path length • An Example: • 4 clusters • Small nodes are attributes Clustering – users’ most valued layout feature
Comparison Force-Directed Graph+TPP
What’s Next? ‘How much better is the clustering?’ Real world domain applications What do we learn about the data from the layout? Evaluation
Publications Gibson, H. (2010) Data-driven layout for the visual analysis of networks. GROUP28: The XXVIII International Colloquium on Group-Theoretical Methods in Physics. Newcastle-upon-Tyne, July 2010. Poster presentation. Gibson, H. , Faith, J. (2011) Node-attribute graph layout for small-world networks. 15th International Conference on Information Visualisation. London, July 2011