Download
1 / 1
10 likes | 121 Views
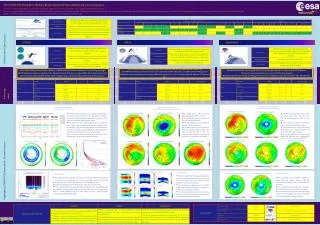
MIPAS on ENVISAT. NEW. NEW. Fig. 2 – IPF validity for the different MIPAS mission scenario. Fig. 5 – Long term mispointing variation. Fig. 7 – Relation between gain and NESR variation for the FR mission. Fig. 6 – Gain factor relative variation since Jan 2005.

E N D
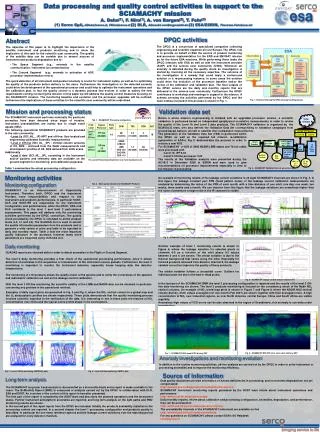
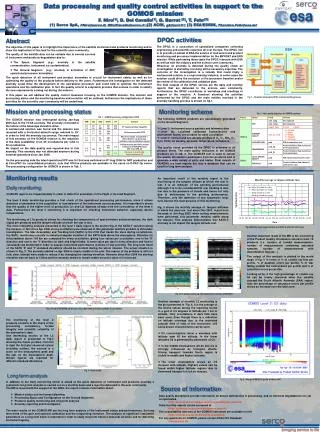
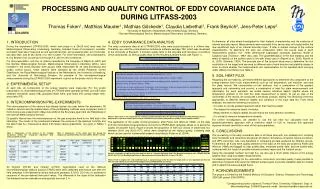
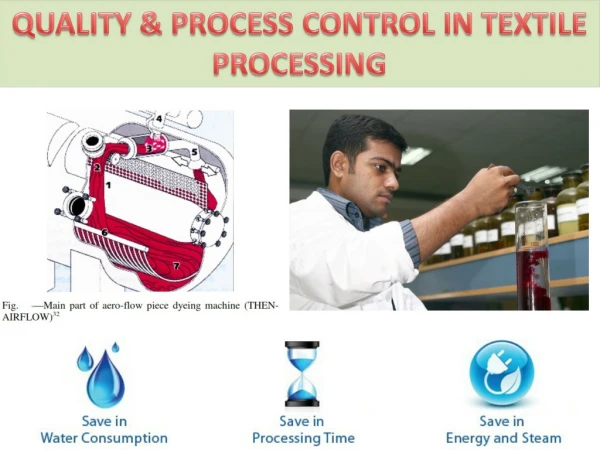
MIPAS on ENVISAT NEW NEW Fig. 2 – IPF validity for the different MIPAS mission scenario. Fig. 5 – Long term mispointing variation. Fig. 7 – Relation between gain and NESR variation for the FR mission. Fig. 6 – Gain factor relative variation since Jan 2005. Fig. 4 – NO2 vertical distribution for one day of measurements (18th Aug 2004). Fig. 3 – Cloud top height map for 13 July 2006. Fig. 8 – Occurrence of corruption in band D from Jul to Nov 2006. Fig. 9 – Density of detected spikes on channel D during Dec 2006 Data processing and quality control activities in support to the MIPAS mission F. Niro(1), T. Fehr(2) (1) Serco SpA, FNiro@serco.it ; (2) ESA/ESRIN, Thorsten.Fehr@esa.int DPQC activities Abstract The DPQC is a consortium of specialized companies collecting engineering and scientific expertise all over Europe. The DPQC role is to provide on behalf of ESA the service of instrument and product monitoring and processor implementation for the ENVISAT and ERS mission. While performing these tasks the DPQC interacts with ESA as well as with the industry and the science user community. Whenever an anomaly is detected during the quality check an investigation is started by involving all the necessary expertise. The outcome of the investigation is a remedy that could imply a workaround solution or a re-processing instance; in some cases the solution could drive the evolution of the processor baseline and/or the review of the calibration and validation plan. The final outputs of the DPQC service are the daily and monthly reports that are delivered to the science user community. Furthermore the DPQC contributes to workshop and meetings in support to the mission. A flowchart showing the activities performed by the DPQC and the main entities involved in the anomaly handling process is shown on fig.1. The objective of this paper is to highlight the importance of the satellite instrument and products monitoring and to show the implication of this task for the scientific user community. • The quality of the satellite data can be variable due to several sources of instrument and products degradation due to: • The Space Segment (e.g.: anomaly in the satellite communication, instrument ice contamination) • The Ground Segment (e.g.: anomaly in activation of ADF, operational processor anomalies) The quick detection of all instrument and product anomalies is crucial for instrument safety, as well as for optimizing the quality of the products before delivery to the users. Furthermore the investigation on the detected anomaly could drive the development of the operational processor and could help to optimize the instrument operations and the calibration plan. In fact the quality control is a dynamic process that evolves in order to satisfy the new requirements coming out during the mission. In this paper we will address the quality control measures focusing on the MIPAS mission. The mission and processing status and the monitoring baseline and evolution will be outlined; furthermore the implications of these activities for the scientific user community will be underlined. Fig. 1 – Flowchart showing the DPQC anomaly handling process. Mission and processing status • The MIPAS processing status is summarized hereafter: • The last processor used in NRT was the IPF 4.61. • IPF 4.61 and 4.62 were used for reprocessing the FR mission. • IPF 4.65 and 4.67 were used to process RR data up to L1. • The only processor able to generate L2 data of the RR mission will be the 5.0 that will be put into operation by the end of 2007. • IPF 5.0 will also be used for reprocessing the whole mission. • The IPF versions and their validity are shown in fig.2. Tab. 1 – MIPAS Processing configuration. • The original FR MIPAS mission was suspended on March 2004 due to increase of IDU error. The “new” RR mission started routinely on Jan 2005 with: • Spectral resolution reduced to 41% of the original • Reduced duty cycle (30 – 50%) • Over-sampling of the vertical domain • Latitude dependent tangent altitude NEW Validation Dataset Status The IDU errors occurrence is decreasing since Feb 2006, as a result the instrument duty cycle was raised in the last month up to 50% and it will be further increased in the future if the instrument performance will keep improving. The actual Ground Segment configuration is depicted in tab.1 where the correspondence of the operational processor (IPF) with the prototype, DPM, ADF and IODD are listed. The current operational processor (4.67) is marked in red, while the upcoming future IPF (5.0) is printed in italic. Before starting the IPF 5.0 implementation a set of specific orbits was selected by the validation teams. These data were chosen in correspondence to collocated remote sensing measurements (e.g. lidar, balloon). These orbits were processed to L1 and L2 using the prototypes with the support of ESL, GRID-Team and DPQC and were made available to the user community. In total 371 level 1 and 140 level 2 products were processed. Thanks to this dataset the validation team will give a first assessment about the accuracy of the new processor and will allow to correct for any undetected systematic error before the IPF 5.0 deployment. Monitoring activities A few examples of monitoring results contained in the MR are presented in the figs. 5 – 7. In fig. 5 the mispointing over the full mission is plotted. We can observe that after the correction of the on-board s/w problem (Dec 2003) the mispointing remains stable around a value of -30 mdeg. In fig. 6 the variation of the gain factor since Jan 2005 is shown. The slope of this curve is a measure of the detector ice contamination. In this plot the improvement observed in the last months can be appreciated. It was due to the fact that more frequent decontaminations are performed. The importance of the gain monitoring is demonstrated in fig.7. In this plot we can see that the gain and NESR variation in band A are strongly correlated. Therefore a gain increase significantly affects the retrieval precision of the L2 products. Tab. 2 – Main quality indicators for MIPAS products. Monitoring configuration • The following operational products are generated on the ground segments from MIPAS measurements: • level 0: instrument source packets and telemetry data • level 1: geo-located and fully calibrated spectra • level 2: profiles of pT, O3, H2O, CH4, NO2, N2O and HNO3 • The quality check provided by the DPQC is extended to all product levels. The main quality indicators in the MIPAS products are in tab. 2. The QUADAS tool is used to extract the quality information parameters from the products and to generate a wide variety of plots and tables. Final outputs of QUADAS are html reports but also a database that can be used for long term analysis. Daily monitoring QUADAS reports are inspected daily by the DPQC in order to detect anomalies in the Flight or Ground Segment. The level 0 daily monitoring provides a first check of the operational processing performance, since it allows detection of anomalies in the acquisition or transmission of the instrument source packets. Furthermore the level 0 monitoring is important for monitoring the instrument behavior, especially devices temperatures and cooler performances as well as ADC counts. The monitoring of MIPAS L1b products allows the quality check of the spectra and the verification of the spectral and radiometric calibration. Indeed many anomalies in the level 2 retrieval are due to an incorrect spectral calibration. With the level 2 monitoring the scientific validity of the geophysical profiles can be checked, in particular concerning any problem in the operational retrieval. Furthermore the L2 products quality check is also an interesting mean to detect on a short term basis the status of the Earth’s atmosphere. Anomaly investigations and monitoring evolution In addition to the routine monitoring activities, ad-hoc analysis are carried out by the DPQC in order to solve instrument or processing anomalies and to improve the monitoring efficiency. An example of anomaly investigation is shown in fig.8. In this figure the monthly occurrence of a corruption in the band D from Jul to Nov 2006 is shown using geo-located maps. We can see that the anomaly occurred always on the South Hemisphere, at low altitude and it moves towards the South Pole when approaching the Antarctic Summer. The investigation has shown that the problem was due to solar light backscattered into the MIPAS FOV by low altitude clouds. The quality monitoring is a dynamic process that evolves in order to meet instrument performances evolution and to improve efficiency of anomaly detection. In this frame new analysis or plots could be added to the routine check. An example is given in fig. 9 where the spikes monitoring in channel D is presented. This plot clearly shows the high density of spikes over the SAA region. After discussion within the QWG this analysis will be added to the MR. Example plots of the QUADAS daily report are shown in figures 3 and 4. In fig. 3 the cloud top height map is shown. This is an interesting analysis that allows for checking correctness of radiometric calibration in band A, but it gives also an interesting information about the atmospheric status, for example in the figure the presence of stratospheric clouds during the Antarctic winter is clearly visible. In fig.4 the NO2 stratospheric distribution is shown, in this plot the white stripes indicate processing failures, on the other hand the typical night/day variation of NO2 VMR is visible and some anomalous enhanced NO2 values can be seen on the high stratosphere. Long term monitoring • In addition to the daily monitoring which is aimed at the quick detection of instrument and products anomaly a systematic long term analysis is carried out on a monthly basis and a report is delivered to the user community. • The MR is issued with the support of the QWG, the report contains information about: • Mission status and instrument planning • Processing Status and Configuration on the Ground Segments • Products quality monitoring and long term analysis • Anomaly reporting and investigation • The main results of the MIPAS MR are the long term analysis of the instrument status and performances, the long term trend of the gain and spectral calibration and the mispointing evolution. The analysis of significant instrument parameters on a long term basis is important in order to study long term trend or seasonal variation and for detecting instrument ageing. Source of information Data quality disclaimers provide information on known deficiencies in processing, they are available at: http://envisat.esa.int/dataproducts/availability/disclaimers/ Daily/monthly reports can be accessed at: http://earth.esa.int/pcs/envisat/mipas/reports/ The unavailability intervals of the MIPAS instrument are available on line http://envisat.esa.int/instruments/availability/ For any questions on MIPAS, please contact ESA’s EO Helpdesk eohelp@esa.int