Download
1 / 42
420 likes | 688 Views
Learning from Learning Curves: Item Response Theory & Learning Factors Analysis . Ken Koedinger Human-Computer Interaction Institute Carnegie Mellon University.

E N D
Learning from Learning Curves: Item Response Theory & Learning Factors Analysis Ken Koedinger Human-Computer Interaction Institute Carnegie Mellon University Cen, H., Koedinger, K., Junker, B. Learning Factors Analysis - A General Method for Cognitive Model Evaluation and Improvement. 8th International Conference on Intelligent Tutoring Systems. 2006.Cen, H., Koedinger, K., Junker, B. Is Over Practice Necessary? Improving Learning Efficiency with the Cognitive Tutor. 13th International Conference on Artificial Intelligence in Education. 2007.
Domain-Specific Cognitive Models • Question: How do students represent knowledge in a given domain? • Answering this question involves deep domain analysis • The product is a cognitive model of students’ knowledge • Recall cognitive models drive ITS behaviors & instructional design decisions
Knowledge Decomposibility Hypothesis • Human acquisition of academic competencies can be decomposed into units, called knowledge components (KCs), that predict student task performance & transfer • Performance predictions • If item I1 only requires KC1 & item I2 requires both KC1 and KC2, then item I2 will be harder than I1 • If student can do I2, then they can do I1 • Transfer predictions • If item I1 requires KC1, & item I3 also requires KC1, then practice on I3 will improve I1 • If item I1 requires KC1, & item I4 requires only KC3, then practice on I4 will not improve I1 • Fundamental EDM idea: • We can discover KCs (cog models) by working these predictions backwards! Example of Items & KCs
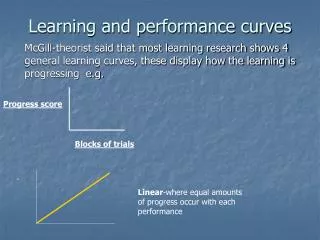
Student Performance As They Practice with the LISP Tutor Mean Error Rate
Production Rule Analysis Evidence for Production Rule as an appropriate unit of knowledge acquisition
Using learning curves to evaluate a cognitive model • Lisp Tutor Model • Learning curves used to validate cognitive model • Fit better when organized by knowledge components (productions) rather than surface forms (programming language terms) • But, curves not smooth for some production rules • “Blips” in leaning curves indicate the knowledge representation may not be right • Corbett, Anderson, O’Brien (1995) • Let me illustrate …
What’s happening on the 6th & 10th opportunities? Curve for “Declare Parameter” production rule • How are steps with blips different from others? • What’s the unique feature or factor explaining these blips?
(defun add-to (el lst) (append lst (list lst))) (defun second (lst) (first (rest lst))) Can modify cognitive model using unique factor present at “blips” • Blips occur when to-be-written program has 2 parameters • Split Declare-Parameter by parameter-number factor: • Declare-first-parameter • Declare-second-parameter
Can learning curve analysis be automated? • Learning curve analysis • Identify blips by hand & eye • Manually create a new model • Qualitative judgment • Need to automatically: • Identify blips by system • Propose alternative cognitive models • Evaluate each model quantitatively
Learning Factors Analysis (LFA): A Tool for KC Analysis • LFA is a method for discovering & evaluating alternative cognitive models • Finds knowledge component decomposition that best predicts student performance & learning transfer • Inputs • Data: Student success on tasks in domain over time • Codes: Factors hypothesized to drive task difficulty & transfer • A mapping between these factors & domain tasks • Outputs • A rank ordering of most predictive cognitive models • For each model, a measure of its generalizability & parameter estimates for knowledge component difficulty, learning rates, & student proficiency
Learning Factors Analysis (LFA) draws from multiple disciplines • Machine Learning & AI • Combinatorial search (Russell & Norvig, 2003) • Exponential-family principal component analysis (Gordon, 2002) • Psychometrics & Statistics • Q Matrix & Rule Space (Tatsuoka 1983, Barnes 2005) • Item response learning model (Draney, et al., 1995) • Item response assessment models (DiBello, et al., 1995; Embretson, 1997; von Davier, 2005) • Cognitive Psychology • Learning curve analysis (Corbett, et al 1995)
Representing Knowledge Components as factors of items Problem: How to represent KC model? Solution: Q-Matrix (Tatsuoka, 1983) Items X Knowledge Components (KCs) Single KC item = when a row has one 1 2*8 above Multi-KC item = when a row has many 1’s 2*8 – 3 What good is a Q matrix? Can predict student accuracy on items not previously seen, based on KCs involved
Prior Summer School project! The Statistical Model • Generalized Power Law to fit learning curves • Logistic regression (Draney, Wilson, Pirolli, 1995) • Assumptions • Some skills may easier from the start than others => use an intercept parameter for each skill • Some skills are easier to learn than others => use a slope parameter for each skill • Different students may initially know more or less => use an intercept parameter for each student • Students generally learn at the same rate => no slope parameters for each student • These assumptions are reflected in a statistical model …
Simple Statistical Model of Performance & Learning Problem: How to predict student responses from model? Solutions: Additive Factor Model (Draney, et al. 1995)
Comparing Additive Factor Model to other psychometric techniques Instance of generalized linear regression, binomial family or “logistic regression” R code: glm(success~student+skill+skill:opportunity, family=binomial,…) Extension of item response theory IRT has simply a student term (theta-i) + item term (beta-j) R code: glm(success~student+item, family=binomial,…) The additive factor model behind LFA is different because: It breaks items down in terms of knowledge component factors It adds term for practice opportunities per component
Model Evaluation • How to compare cognitive models? • A good model minimizes prediction risk by balancing fit with data & complexity (Wasserman 2005) • Compare BIC for the cognitive models • BIC is “Bayesian Information Criteria” • BIC = -2*log-likelihood + numPar * log(numOb) • Better (lower) BIC == better predict data that haven’t seen • Mimics cross validation, but is faster to compute 18
Item Labeling & the “P Matrix”: Adding Alternative Factors Problem: How to improve existing cognitive model? Solution: Have experts look for difficulty factors that are candidates for new KCs. Put these in P matrix. Q Matrix P Matrix
Using P matrix to update Q matrix Create a new Q’ by using elements of P as arguments to operators Add operator: Q’ = Q + P[,1] Split operator: Q’ = Q[, 2] * P[,1] Q- Matrix after add P[, 1] Q- Matrix after splitting P[, 1], Q[,2]
LFA: KC Model Search • Problem: How to find best model given Q and P matrices? • Solution: Combinatorial search • A best-first search algorithm (Russell & Norvig 2002) • Guided by a heuristic, such as BIC • Goal: Do model selection within logistic regression model space Steps: • Start from an initial “node” in search graph using given Q • Iteratively create new child nodes (Q’) by applying operators with arguments from P matrix • Employ heuristic (BIC of Q’) to rank each node • Select best node not yet expanded & go back to step 2
Area Unit of Geometry Cognitive Tutor Parallelogram-area Parallelogram-side Pentagon-area Pentagon-side Trapezoid-area Trapezoid-base Trapezoid-height Triangle-area Triangle-side • Original cognitive model in tutor: 15 skills: Circle-area Circle-circumference Circle-diameter Circle-radius Compose-by-addition Compose-by-multiplication
Q-matrix in single column: works for single KC items Opportunities Student has had to learn KC Log Data Input to LFA Items = steps in tutors with step-based feedback
AFM Results for original KC model Higher intercept of skill -> easier skill Higher slope of skill -> faster students learn it Higher intercept of student -> student initially knew more The AIC, BIC & MAD statistics provide alternative ways to evaluate models MAD = Mean Absolute Deviation
Application: Use Statistical Model to improve tutor initial error rate 12%reduced to 8% after 18 times of practice initial error rate 76%reduced to 40% after 6 times of practice Some KCs over-practiced, others under(Cen, Koedinger, Junker, 2007) 26
“Close the loop” experiment In vivo experiment: New version of tutor with updated knowledge tracing parameters vs. prior version Reduced learning time by 20%, same robust learning gains Knowledge transfer: Carnegie Learning using approach for other tutor units 27
Example in Geometry of split based on factor in P matrix After Splitting Circle-area by Embed Original Q matrix Factor in P matrix New Q matrix Revised Opportunity
LFA –Model Search Process • Search algorithm guided by a heuristic: BIC • Start from an existing KC model (Q matrix) Automates the process of hypothesizing alternative KC models & testing them against data
LFA Results 1: Applying splits to original model • Common results: • Compose-by-multiplication split based on whether it was an area or a segment being multiplied • Circle-radius is split based on whether it is being done for the first time in a problem or is being repeated • Made sense, but less than expected …
Example of Tutor Design Implications • LFA search suggests distinctions to address in instruction & assessment With these new distinctions, tutor can • Generate hints better directed to specific student difficulties • Improve knowledge tracing & problem selection for better cognitive mastery • Example: Consider Compose-by-multiplication before LFA With final probability .92, many students are short of .95 mastery threshold
Making a distinction changes assessment decision • However, after split: • CM-area and CM-segment look quite different • CM-area is now above .95 mastery threshold (at .96) • But CM-segment is only at .60 • Implications: • Original model penalizes students who have key idea about composite areas (CM-area) -- some students solve more problems than needed • CM-segment is not getting enough practice • Instructional design choice: Add instructional objective & more problems or not?
Perhaps original model is good enough -- Can LFA recover it? • Merge some skills in original model, to produce 8 skills: • Circle-area, Circle-radius => Circle • Circle-circumference, Circle-diameter => Circle-CD • Parallelogram-area, Parallelogram-side => Parallelogram • Pentagon-area, Pentagon-side => Pentagon • Trapezoid-area, Trapezoid-base, Trapezoid-height => Trapezoid • Triangle-area, Triangle-side => Triangle • Compose-by-addition • Compose-by-multiplication • Does splitting by “backward” (or otherwise) yield a better model? Closer to original?
LFA Results 2: Recovery • Only 1 recovery: Circle-area vs. Circle-radius • More merged model fits better • Why? More transfer going on than expected or not enough data to make distinctions? Other relevant data sets …
Open Research Questions: Technical • What factors to consider? P matrix is hard to create • Enhancing human role: Data visualization strategies • Other techniques: Principal Component Analysis + • Other data: Do clustering on problem text • Interpreting LFA output can be difficult • LFA outputs many models with roughly equivalent BICs • How to select from large equivalence class of models? • How to interpret results? => Researcher can’t just “go by the numbers”1) Understand the domain, the tasks2) Get close to the data
DataShop Case Study video • “Using DataShop to discover a better knowledge component model of student learning”
Summary of Learning Factors Analysis (LFA) • LFA combines statistics, human expertise, & combinatorial search to discover cognitive models • Evaluates a single model in seconds, searches 100s of models in hours • Model statistics are meaningful • Improved models suggest tutor improvements • Other applications of LFA & model comparison • Used by others: • Individual differences in learning rate (Rafferty et. al., 2007) • Alternative methods for error attribution (Nwaigwe, et al. 2007) • Model comparison for DFA data in math (Baker; Rittle-Johnson) • Learning transfer in reading (Leszczenski & Beck, 2007)
Open Research Questions: Psychology of Learning • Test statistical model assumptions: Right terms? • Is student learning rate really constant? • Does a Student x Opportunity interaction term improve fit? • What instructional conditions or student factors change rate? • Is knowledge space “uni-dimensional”? • Does a Student x KC interaction term improve fit? • Need different KC models for different students/conditions? • Right shape: Power law or an exponential? • Long-standing hot debate • Has focused on “reaction time” not on error rate! • Other predictor & outcome variables (x & y of curve) • Outcome: Error rate => Reaction time, assistance score • Predictor: Opportunities => Time per instructional event
Open Research Questions: Instructional Improvement • Do LFA results generalize across data sets? • Is BIC a good estimate for cross-validation results? • Does a model discovered with one year’s tutor data generalize to a next year? • Does model discovery work in ill-structured domains? • Use learning curves to compare instructional conditions in experiments • Need more “close the loop” experiments • EDM => better model => better tutor => better student learning