Download
1 / 26
260 likes | 347 Views
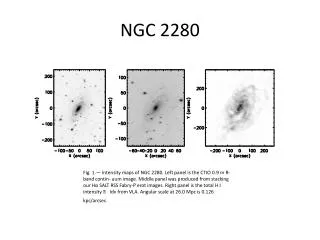
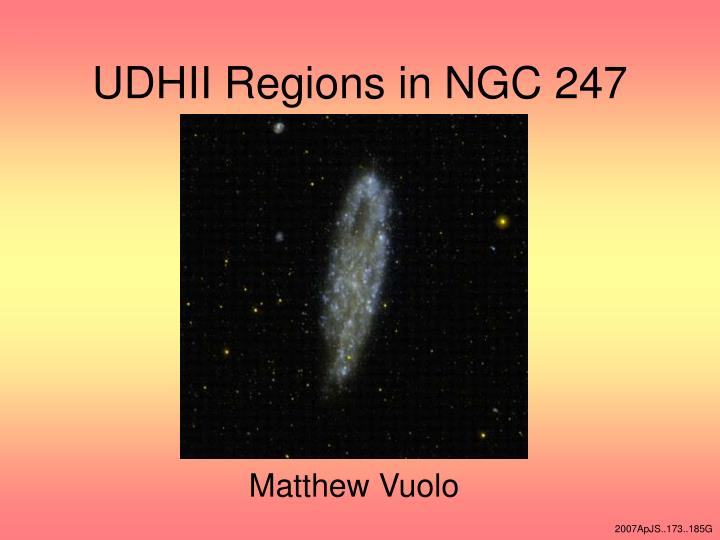
UDHII Regions in NGC 247. Matthew Vuolo. 2007ApJS..173..185G. Introduction / Purpose. NGC 247 Very Large Array (VLA) Primary Task: Identify and confirm the existence of Ultradense HII (UDHII) regions in NGC 247.

E N D
UDHII Regions in NGC 247 Matthew Vuolo 2007ApJS..173..185G
Introduction / Purpose • NGC 247 • Very Large Array (VLA) • Primary Task: Identify and confirm the existence of Ultradense HII (UDHII) regions in NGC 247 Some of the 27 antennas used by the VLA to collect data. The antennas are moved around to different configurations, and thus different resolutions, by the tracks they sit on. Courtesy of NRAO
What is an H II Region? • Region where massive star formation is taking place • Stars emit UV photons that ionize H atoms. • H atom recombines The Orion Nebula, an H II region http://apod.nasa.gov/apod/ap090222.html
What is an UDHII region? • Ultracompact HII (UCHII) region • Newly formed massive stars still embedded in their birth material • Ultradense HII (UDHII) region • Only detectable in mid-to-far-IR and radio
How do we identify an UDHII region? • Spectral Index, α, is defined as follows: ___________________ Sν ∞ ν-α α = - log(S20 / S6) δα = - √(δS20/S20)2 + (δS6/S6)2| log(1.45GHz/4.86GHz) log(1.45GHz/4.86GHz) • α compares flux densities of a source in different frequencies (20cm and 6cm for this research) • α gives the slope of the curve for a frequency vs. luminosity graph of a source • HII Region (Thermal spectrum): -0.2 < α < 0.2 • SNR (Nonthermal spectrum): α > 0.2 • UDHII Region (Inverted spectrum): α < -0.2
Method • Uploaded previously produced images • Astronomical Image Processing System (AIPS) • Identification of candidate sources • Only picked up sources > 3 times the noise • Measurements of identified sources • Found integrated and peak flux densities
6cm, Res: 0.371”, BnC hybrid array, VLA. • Legend: Crosshair = SNR Circle = UDHII region Square = Indeterminate Diamond = HII Region Triangle = UDHII or HII region. • Contour plot • Plot axes: RA / Dec • Sources with a spectral index are plotted • Better Sensitivity in the center of the image • Interference Striping (bottom left to upper right)
20cm, Res: 0.309”, AnB array, VLA • Legend: • Crosshair = SNR Circle = UDHII region Square = Indeterminate Diamond = HII Region Triangle = UDHII or HII region. • Contour plot • Plot axes: RA / Dec • Interference Striping
Correspondence to Other Wavelengths • Should be a correspondence in emission at optical and IR wavelengths • Can learn various information • Publically available images were retrieved from NASA/IPAC Extragalactic Database (NED) • H-Band (IR) (1.2 μm) • J-Band (IR) (1.6 μm) • K-Band (IR) (2.2 μm) • V-Band (Optical) (5500 Å) • Hα (Optical) (6290 Å)
IR (H-Band), Res: 2.50”, 2MASS • Legend: • Crosshair = SNR Circle = UDHII region Square = Indeterminate Diamond = HII Region Triangle = UDHII or HII region • Greyscale Image • Larger field of view than radio images 2003AJ....125..525J
IR (J-Band), Res: 2.50”, 2MASS • Legend: • Crosshair = SNR Circle = UDHII region Square = Indeterminate Diamond = HII Region Triangle = UDHII or HII region • Greyscale Image 2003AJ....125..525J
IR (K-Band), Res: 2.50”, 2MASS • Legend: • Crosshair = SNR Circle = UDHII region Square = Indeterminate Diamond = HII Region Triangle = UDHII or HII region • Greyscale Image 2003AJ....125..525J
Issues with the V-Band and Hα Images • The images lacked RA / Dec coordinates • United States Naval Observatory (USNO) was utilized • Contains optical image of NGC 247 and known sources (mainly stars) within the galaxy • Match up the sources in my unlabeled image with the USNO • ~30 sources for Hα and ~15 sources for V-Band were cross-matched • AIPS can take these RA / Dec coordinates and calculate RA / Dec for the entire image
Hα, Res: 1.50”, Danish 1.54m • Greyscale Image 1999A&A...345...59L
Optical (V-Band), Res: 0.70”, LSO 2.5m • Greyscale Image 2001AJ....122..729K
Hα, Res: 1.50”, Danish 1.54m. • Legend: Crosshair = SNR Circle = UDHII region, Square = Indeterminate Diamond = HII Region Triangle = UDHII or HII region • Greyscale Image • One of the images that originally had no native coordinates.
Optical (V-Band), Res: 0.70”, LSO 2.5m • Legend: • Crosshair = SNR Circle = UDHII region Square = Indeterminate Diamond = HII Region Triangle = UDHII or HII region • Greyscale Image • One of the images that originally had no native coordinates.
Re-production of 20cm and 6cm Images • We decided to re-image the radio data to see if we could get better signal to noise and fewer interference artifacts. • Raw data was downloaded from VLA archives • ~3 hours of observation time at each wavelength • Created two different 6cm images • One has better sensitivity, but a smaller field of view • The 6cm image with the larger field of view was used to measure sources out of the field of view of the other 6cm image
6cm, 0.371”, BnC hybrid array, VLA • Legend: • Crosshair = SNR Circle = UDHII region Square = Indeterminate Diamond = HII Region Triangle = UDHII or HII region • Contour plot • Better sensitivity of the two 6cm images • Any sources appearing in this image were measured and used for the final results
6cm, 0.989”, C array, VLA • Legend: • Crosshair = SNR Circle = UDHII region Square = Indeterminate Diamond = HII Region Triangle = UDHII or HII region • Contour plot • Only sources appearing near the edges of the image were measured and used for the final results
20cm, Res: 0.309”, AnB array, VLA • Legend: • Crosshair = SNR Circle = UDHII region Square = Indeterminate Diamond = HII Region Triangle = UDHII or HII region • Contour plot • Measurements used in the final results are from this image
New 20cm (left) vs. Old 20cm (right)
Table: Image Correspondence • Key: • “NII” = “Not In Image” – the candidate source is not within the field of view of this image. • “TMN” = “Too Much Noise” – The area around the candidate source has too high an RMS, but there could still be something there if better data were obtained. • “Maybe” = The candidate source was likely very faint in the image, hovering just above the noise level. • 8-10 Hαcorrespondence • 3-4 V-Band correspondence • 4-5 H-Band (IR) correspondence
Results • Total of 29 compact radio sources were found • 9 candidate SNRs • 1 HII region (20-18) • 1 UDHII region (N6-14) • 2 HII or UDHII regions • 20-12A • N6-12 • 16 indeterminate sources
20cm (left), Res: 0.309”, AnB array, VLA 6cm (right), Res: 0.371”, BnC hybrid array, VLA Zoomed in contour plot of the candidate UDHII region (N6-14)
Conclusion • High number of indeterminate sources caused by large errors in the spectral index • Need more observation time with the VLA to get more sensitive data • Better understanding of MSF will lead to a better understanding of the evolution of interstellar medium and galaxy formation • UDHII could be the adolescent versions of globular clusters • Observed MSF in Milky Way is lower than expected • Turnover point can yield certain properties of the UDHII regions, such as electron density and metallicity gradients