Download
1 / 38
380 likes | 502 Views
Aging in an Aging Society Diversity, Challenges, and Potential for Civic Engagement. Victor W. Marshall, PhD UNC Institute on Aging Victor_marshall@unc.edu. Lifelong Access Libraries Institute UNC at Chapel Hill July 31, 2006. Outline. The Aging of America

E N D
Aging in an Aging SocietyDiversity, Challenges, and Potential for Civic Engagement Victor W. Marshall, PhD UNC Institute on Aging Victor_marshall@unc.edu Lifelong Access Libraries Institute UNC at Chapel Hill July 31, 2006
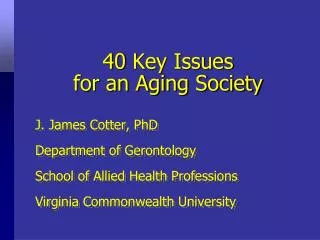
Outline • The Aging of America • Diversity of the Older Population • Family and Household • Factors Associated with Civic Engagement
THE AGING OF AMERICA Three Factors Affect the Age Structure of any Population • Birth Rates (which have fallen) • Life Expectancy (which has increased) • Immigration and Migration Rates
U.S. Population Pyramids 1990 2025 2050 Age Percent Male (blue) and Female (green) Source of charts: US Census Bureau
Declining Fertility • US completed fertility higher than most industrialized countries (about 1.9) • But has declined (from 3.1 in 1975) • Hispanic women’s birth rate 66% higher than non-hispanic white women (96.9/1000 aged 15-44 versus 58.5) Source: US Census Bureau
2000, life expectancy at birth – 77 years 1900, Life expectancy at birth – 47 years 18 more years 12 more years 6 more years 4 more years
70 million 35 million 21million 3 million 4.2 million
Increases in the Oldest OldU.S. Population Aged 85+ (millions) Source of data: U.S. Census Bureau, “We the American Elderly,” September 1993.
Percentage of Americans Age 65 Expected to Survive Age 90 Four-fold increase Source of data: US Census Bureau
Living to 100Number of Centenarians in the U.S. 24% of all elderly 10% of all elderly Source of data: US Census Bureau, Current Populations Reports, P23-199RV, July 1999
Population Changes • According to Census Bureau projections, the elderly population will more than double between now and the year 2050, to 80 million. • Much of this growth is attributed to the "baby boom" generation which will enter their elderly years between 2010 and 2030. • The most populous States are also the ones with the largest number of elderly. However, the States with the greatest proportion of elderly are generally different from those with the greatest number. Source of data: US Census Bureau
Percent of Total State Population 65 Years and Over: 1995 to 2025
Moving to the Sun BeltNet Migration, Age 65+, 1985-1990 Negative Net Migration Positive Net Migration Source of data: Longino, Charles F. Retirement Migration in America. Houston: Vacation Publishers, 1995.
Gender, Race, Class, and Health Differentiation • Elderly women outnumber elderly men. • The elderly are becoming more racially and ethnically diverse. • Poverty rates rise with advancing age. • Great variability by health status
Women Live LongerU.S. Population by Gender and Age (2000) All Ages Age 65+ Age 85+ Male48.9% Male30.1% Male41.6% Female51.1% Female58.4% Female69.9% Source of data: US Census Bureau, Resident Population Estimates of the United States by Age and Sex, 2000
Older Women More Likely to Live AloneLiving Arrangements of Older Adults in U.S. (1998) WOMEN MEN Source of data: US Census Bureau, Current Population Survey, P20-514, March 1998
Differences in Life ExpectanciesAt Age 65 (1998) Source of data: National Vital Statistics Report, Vol. 47, No. 13, December 24, 1998
Projected ChangesRacial Background of U.S. Elderly (2050) *Note: Persons of Hispanic origin may be of any race. Source of data: U.S. Census Bureau, “We the American Elderly,” September 1993.
Income, 65+ Households Source: Civic Ventures Fact Sheet on Older Americans
At Risk from PovertyPercent of 65+ in Poverty in the U.S. (1998) All 65+ persons10.5% Source of data: US Census Bureau, Poverty in the United States: 1998 (P60-207)
1984 Average – $98,900 Whites – $113,400 Blacks – $25,600 2001 Average – $179,800 Whites – $205,000 Blacks – $41,000 Change in Median Net Worth of 65+ Households: 1984 - 2001 Source: Panel Study of Income Dynamics
Older Adults More Likely to Have Disabilities Source of data: Current Population Reports, “Americans with Disabilities, 1994-95,” P70-61, August 1997.
Factors Related to Active Aging and Civic Engagement • EDUCATION: Volunteering, but also work in paid employment higher with increased education • LABOR FORCE PARTICIPATION: Is increasing at older ages and policy thrusts will increase it more • CAREGIVING: Will place increasing strain on baby boomers and younger old people
Flexibility is a Key • Baby boomers and older workers want flexibility in working patterns– for example, phased retirement, flexible hours, telecommuting. This should apply to volunteering and civic engagement activities
High School Total – 72% White alone – 76% Asian alone – 70% Black alone – 52% Hispanic of any race – 36% Bachelor’s Degree Total – 17% White alone – 19% Asian alone – 29% Black alone – 10% Hispanic of any race –6% Educational Attainment of Population 65+ by Race and Hispanic Origin: 2003 1950 – 3% 1950 – 17% Source: US Census Bureau, Current Population Survey Annual Social and Economic Supplement
“Reimagining America: AARP’s Blueprint for the Future”. 2005
Value and Cost of Informal Caregiving • 12.8 million Americans need care • 7.3 million are 65 and older • The value of informal caregiving is estimated at $196 billion per year • Informal caregiving exceeds nursing home and home care expenses by $81 billion • Caregiving costs U.S. businesses $11.4 billion annually • Caregivers lose up to $659,139 over a lifetime Geriatric Social Work Initiative, San Jose State University, College of Social Work
Older Adults as Volunteers Source: Independent Sector, America’s Senior Volunteers, June 2000
What the Demographic Data Tell Us • The population is aging and the older adult population is the fastest growing sector • Older adults becoming more racially and ethnically diverse.
What the Demographic Data Tell Us • Additional sources of diversity such as education, health, and family status suggest a highly variable constituency for libraries and for civic engagement initiatives • The majority of older adults report good health and many are able to work and contribute to family and society
Acknowledgments • Danielle Borasky, Associate Director for Library and Information Services, UNC Institute on Aging, and the “Digital Carousel” on the IOA website • Mary Altpeter, Associate Director for Program Development, UNC Institute on Aging