Download
1 / 46
460 likes | 514 Views
Chapter 52. Population Ecology. Population ecology is the study of populations in relation to environment, including environmental influences on density and distribution, age structure, and population size.

E N D
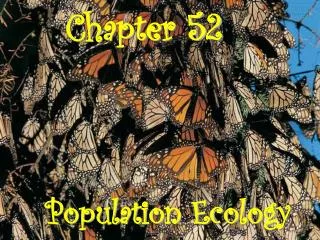
Chapter 52 Population Ecology
Population ecology is the study of populations in relation to environment, including environmental influences on density and distribution, age structure, and population size
Concept 52.1: Dynamic biological processes influence population density, dispersion, and demography • A population is a group of individuals of a single species living in the same general area
Density and Dispersion • Density is the number of individuals per unit area or volume • Dispersion is the pattern of spacing among individuals within the boundaries of the population
LE 52-2 Immigration Births Population Dynamics Population size Emigration Deaths
In a clumped dispersion, individuals aggregate in patches • A clumped dispersion may be influenced by resource availability and behavior Video: Flapping Geese (clumped)
LE 52-3a Clumped. For many animals, such as these wolves, living in groups increases the effectiveness of hunting, spreads the work of protecting and caring for young, and helps exclude other individuals from their territory.
A uniform dispersion is one in which individuals are evenly distributed • It may be influenced by social interactions such as territoriality Video: Albatross Courtship (uniform)
LE 52-3b Uniform. Birds nesting on small islands, such as these king penguins on South Georgia Island in the South Atlantic Ocean, often exhibit uniform spacing, maintained by aggressive interactions between neighbors.
In a random dispersion, the position of each individual is independent of other individuals Video: Prokaryotic Flagella (Salmonella typhimurium) (random)
LE 52-3c Random. Dandelions grow from windblown seeds that land at random and later germinate.
Demography • Demography is the study of the vital statistics of a population and how they change over time • Death rates and birth rates are of particular interest to demographers
Life Tables • A life table is an age-specific summary of the survival pattern of a population
Survivorship Curves • A survivorship curve is a graphic way of representing the data in a life table • The survivorship curve for Belding’s ground squirrels shows a relatively constant death rate
LE 52-4 1,000 100 Number of survivors (log scale) Females 10 Males 1 2 0 10 6 8 4 Age (years)
Survivorship curves can be classified into three general types: Type I, Type II, and Type III 1,000 I 100 II Number of survivors (log scale) 10 III 1 100 50 0 Percentage of maximum life span
Reproductive Rates • A reproductive table, or fertility schedule, is an age-specific summary of the reproductive rates in a population • It describes reproductive patterns of a population
Per Capita Rate of Increase • If immigration and emigration are ignored, a population’s growth rate (per capita increase) equals birth rate minus death rate • Birth – Death = growth rate • Zero population growth occurs when the birth rate equals the death rate
Exponential Growth • Exponential population growth is population increase under idealized conditions • Under these conditions, the rate of reproduction is at its maximum, called the intrinsic rate of increase
2,000 dN • Exponential population growth results in a J-shaped curve = 1.0N dt 1,500 dN = 0.5N dt Population size (N) 1,000 500 0 15 10 5 0 Number of generations
LE 52-10 8,000 6,000 Elephant population 4,000 2,000 0 1920 1900 1980 1960 1940 Year The J-shaped curve of exponential growth characterizes some rebounding populations
Concept 52.4: The logistic growth model includes the concept of carrying capacity • Exponential growth cannot be sustained for long in any population • A more realistic population model limits growth by incorporating carrying capacity • Carrying capacity (K) is the maximum population size the environment can support
LE 52-11 Maximum Per capita rate of increase (r) Positive N = K 0 Negative Population size (N)
2,000 • The logistic model of population growth produces a sigmoid (S-shaped) curve dN = 1.0N Exponential growth dt 1,500 K = 1,500 Logistic growth Population size (N) 1,000 dN 1,500 – N = 1.0N dt 1,500 500 0 0 15 10 5 Number of generations
LE 52-13a 1,000 800 600 Number of Paramecium/mL 400 200 0 5 10 15 0 Time (days) A Paramecium population in the lab
180 • Some populations overshoot K before settling down to a relatively stable density 150 120 Number of Daphnia/50 mL 90 60 30 0 20 40 80 60 100 120 140 0 160 Time (days) A Daphnia population in the lab
LE 52-13c 80 60 Number of females 40 20 0 1980 1985 1995 1990 2000 1975 Time (years) A song sparrow population in its natural habitat
The Logistic Model and Life Histories • Life history traits favored by natural selection may vary: • K-selection, or density-dependent selection, selects for life history traits that are sensitive to population density • r-selection, or density-independent selection, selects for life history traits that maximize reproduction
Concept 52.5: Populations are regulated by a complex interaction of biotic and abiotic influences • There are two general questions about regulation of population growth: • What environmental factors stop a population from growing? • Why do some populations show radical fluctuations in size over time, while others remain stable?
Population Change and Population Density • In density-independent populations, birth rate and death rate do not change with population density • In density-dependent populations, birth rates fall and death rates rise with population density
LE 52-14 Density-dependent birth rate Density-dependent birth rate Density- independent death rate Density- dependent death rate Birth or death rate per capita Equilibrium density Equilibrium density Population density Population density Density-dependent death rate Density- independent birth rate Equilibrium density Population density
LE 52-15 4.0 10,000 3.8 3.6 Average number of seeds per reproducing individual (log scale) 1,000 Average clutch size 3.4 3.2 3.0 100 2.8 0 10 60 20 30 70 40 100 10 80 1 50 Plants per m2 (log scale) Females per unit area Plantain. The number of seeds produced by plantain (Plantago major) decreases as density increases. Song sparrow. Clutch size in the song sparrow on Mandarte Island, British Columbia, decreases as density increases and food is in short supply.
Territoriality • In many vertebrates and some invertebrates, territoriality may limit density
Other Factors • Health • Predation • Toxic Wastes
Many populations undergo boom-and-bust cycles • Boom-and-bust cycles are influenced by complex interactions between biotic and abiotic factors
LE 52-21 Snowshoe hare 160 120 9 Lynx Lynx population size (thousands) Hare population size (thousands) 80 6 40 3 0 0 1925 1850 1875 1900 Year
The Global Human Population • The human population increased relatively slowly until about 1650 and then began to grow exponentially 6 5 4 Human population (billions) 3 2 The Plague 1 0 2000 B.C. 1000 B.C. 4000 B.C. 3000 B.C. 0 1000 A.D. 8000 B.C. 2000 A.D.
LE 52-23 2.2 2 1.8 1.6 2003 1.4 Annual percent increase 1.2 1 0.8 0.6 0.4 0.2 0 2000 2050 1975 1950 2025 Year
Regional Patterns of Population Change • To maintain population stability, a regional human population can exist in one of two configurations: • Zero population growth = High birth rate – High death rate • Zero population growth =Low birth rate – Low death rate • The demographic transition is the move from the first state toward the second state
LE 52-24 50 40 30 Birth or death rate per 1,000 people 20 10 Sweden Mexico Birth rate Birth rate Death rate Death rate 0 2050 1950 1850 1750 1900 2000 1800 Year
Age Structure • One important demographic factor in present and future growth trends is a country’s age structure • Age structure is the relative number of individuals at each age • It is commonly represented in pyramids
LE 52-25 Rapid growth Afghanistan Decrease Italy Slow growth United States Male Female Male Female Age Male Female Age 85+ 80–84 75–79 70–74 65–69 60–64 55–59 50–54 85+ 80–84 75–79 70–74 65–69 60–64 55–59 50–54 45–49 40–44 35–39 30–34 25–29 20–24 15–19 10–14 5–9 0–4 45–49 40–44 35–39 30–34 25–29 20–24 15–19 10–14 5–9 0–4 8 0 2 4 8 6 6 8 0 2 4 8 4 2 6 6 8 0 2 4 4 2 6 6 8 4 2 Percent of population Percent of population Percent of population
LE 52-26 60 80 50 60 40 Life expectancy (years) Infant mortality (deaths per 1,000 births) 30 40 20 20 10 0 0 Developed countries Developing countries Developed countries Developing countries
Ecological Footprint • The ecological footprint concept summarizes the aggregate land and water area needed to sustain the people of a nation • It is one measure of how close we are to the carrying capacity of Earth • Countries vary greatly in footprint size and available ecological capacity
LE 52-27 16 14 12 New Zealand 10 USA Germany Australia 8 Ecological footprint (ha per person) Netherlands Japan Canada Norway 6 Sweden UK 4 Spain World 2 China India 0 16 6 14 2 4 10 12 0 8 Available ecological capacity (ha per person)