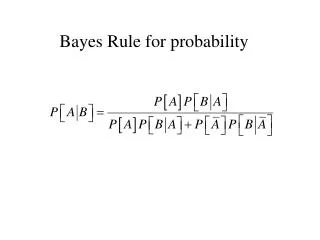
Download
1 / 25
640 likes | 1.42k Views
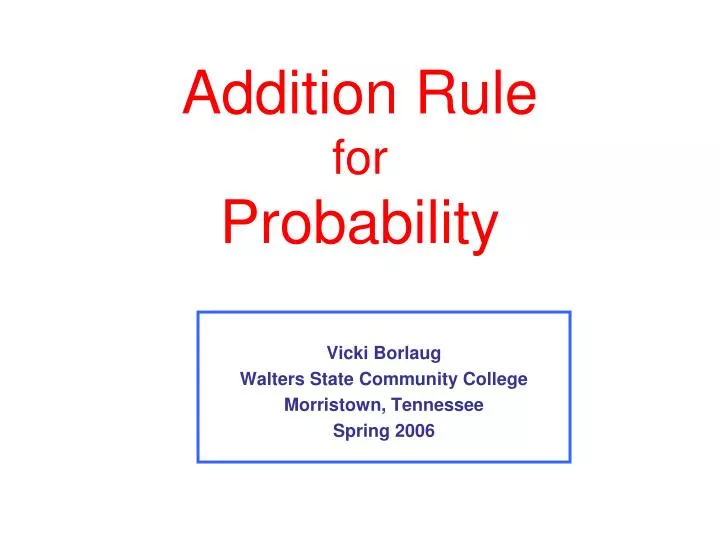
Addition Rule for Probability. Vicki Borlaug Walters State Community College Morristown, Tennessee Spring 2006. “ and ” means both must be true. “ or ” means one or the other (or both) are true. FALSE. TRUE. This is Rita. Are the statements TRUE or FALSE?.

E N D
Addition RuleforProbability Vicki Borlaug Walters State Community College Morristown, Tennessee Spring 2006
“and” means both must be true “or” means one or the other (or both) are true FALSE TRUE This is Rita. Are the statements TRUE or FALSE? Rita is playing the violin and soccer. Rita is playing the violin or soccer.
Elm St. Elm St. Maple St. Maple St. Elm or Maple Elm and Maple This is called INTERSECTION. This is called UNION. Which one is “Elm and Maple”? Which one is “Elm or Maple”? Like when you put the North and the South together. Like when two streets cross.
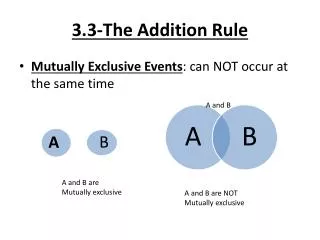
A B Next we will look at Venn Diagrams. In a Venn Diagram the box represents the entire sample space. Members that fit Event A go in this circle. Members that fit Event B go in this circle.
A A B B Event A and B Event A or B This is called INTERSECTION. This is called UNION. Which is “A and B”? Which is “A or B”?
A A A A A B B B B B The Addition Rule for Probability _ + = P(A or B) = P(A) + P(B) - P(A and B) But we have added this piece twice! That is one extra time! We need to subtract off the extra time!
Example #1) Given the following probabilities: P(A)=0.8 P(B)=0.3 P(A and B)=0.2 Find the P(A or B). This can be solved two ways. 1. Using Venn Diagrams 2. Using the formula We will solve it both ways.
Example #1 (continued) P(A)=0.8 P(B)=0.3 P(A and B)=0.2 Find the P(A or B). A B Solution using Venn Diagrams: In this example we will fill up the Venn Diagram with probabilities.
Example #1 (continued) P(A)=0.8 P(B)=0.3 P(A and B)=0.2 Find the P(A or B). A B Solution using Venn Diagrams: The probability that a student fits the event B is 0.3. The probability that a student fits the event A is 0.8. First fill in where the events overlap. The box represents the entire sample space and must add up to 1. That means the entire A circle must add up to0.8. The probability that a student fits the event Aand B is0.2. That means the entire B circle must add up to0.3. 0.6 0.6 0.2 0.2 0.1 0.1 0.1 0.1
A B = 0.9 Answer Then find the probability of A or B. I will start by shading A or B. 0.6 0.6 0.2 0.2 0.1 0.1 Then I will add up the probabilities in the shaded area. 0.1 P(A or B) = 0.6 + 0.2 + 0.1
Example #1 (continued) P(A)=0.8 P(B)=0.3 P(A and B)=0.2 Find the P(A or B). Answer Solution using the formula: P(A or B) = P(A) + P(B) - P(A and B) = 0.8 + 0.3 - 0.2 = 0.9
Example #2.) There are 50 students. 18 are taking English. 23 are taking Math. 10 are taking English and Math. If one is selected at random, find the probability that the student is taking English or Math. E = taking English M = taking Math
E M Example #2 (continued) There are 50 students. 18 are taking English. 23 are taking Math. 10 are taking English and Math. If one is selected at random, find the probability that the student is taking English or Math. Solution using Venn Diagrams: In this example we will fill up the Venn Diagram with the number of students.
E M Example #2 (continued) There are 50 students. 18 are taking English. 23 are taking Math. 10 are taking English and Math. If one is selected at random, find the probability that the student is taking English or Math. Solution using Venn Diagrams: The number of students taking English is 18. The number of students taking Math is 23. First fill in where the events overlap. The box represents the entire sample space and must add up to 50. That means the number of students taking Math must add up to23. That means the number of students taking English must add up to18. The number of students taking Englishand Math is10. 8 8 10 10 13 13 19 19
E M = 0.62 Answer Then find the probability of English or Math. I will start by shading E or M. 8 8 10 10 13 13 Then I will find the probability in the shaded area. 19 P(E or M) =
=0.62 Answer Example #2 (continued) There are 50 students. 18 are taking English. 23 are taking Math. 10 are taking English and Math. If one is selected at random, find the probability that the student is taking English or Math. Solution using the formula: P(E or M) = P(E) + P(M) - P(E and M)
Class Activity #1) There are 1580 people in an amusement park. 570 of these people ride the rollercoaster. 700 of these people ride the merry-go-round. 220 of these people ride the roller coaster and merry-go-round. If one person is selected at random, find the probability that that person rides the roller coaster or the merry-go-round. a.) Solve using Venn Diagrams. b.) Solve using the formula for the Addition Rule for Probability.
Example #3) Population of apples and pears. Each member of this population can be described in two ways. 1. Type of fruit 2. Whether it has a worm or not We will make a table to organize this data.
? ? grand total14 ? ? Example #3) Population of apples and pears. no worm worm ? 8 5 3 ? apple ? 4 2 ? 6 pear 9 5
Ex. #3 (continued) no worm worm 8 5 3 apple 4 2 6 pear grand total14 9 5 Experiment: One is selected at random. Find the probability that . . . a.) . . . it is a pear andhas a worm. b.) . . . it is a pear or has a worm.
Ex. #3 (continued) no worm worm 8 5 3 apple 4 2 6 pear Answer grand total14 9 5 Solution to #3a.) P(pear and worm) =
Ex. #3 (continued) no worm worm 8 5 3 apple 4 2 6 pear Answer grand total14 9 5 Solution to #3b.) P(pear or worm) =
Ex. #3 (continued) no worm worm 8 5 3 apple 4 2 6 pear Answer grand total14 9 5 Alternate Solution to #3b.) P(pear or worm)= P(pear) + P(worm) – P (pear and worm)
Class Activity #2) There are our modes of transportation – horse, bike, & canoe. Each has a person or does not have a person. 1.) Make a table to represent this data. 2.) If one is selected at random find the following: a.) P( horse or has a person) b.) P( horse and has a person) c.) P( bike or does not have a person)