Download
1 / 19
200 likes | 431 Views
Ethylene Furnace High Temperature Cameras. Burner Flame Detection, Tube Temperature and Failure Monitoring. Introduction. Vision enables temperature analysis capability to all portions of the viewing screen. Flame detection and size analysis Tube movement / distortion.

E N D
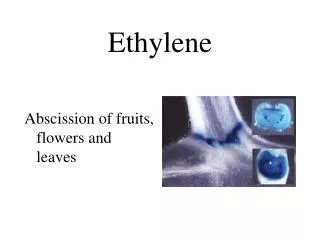
Ethylene Furnace High Temperature Cameras Burner Flame Detection, Tube Temperature and Failure Monitoring
Introduction • Vision enables temperature analysis capability to all portions of the viewing screen. • Flame detection and size analysis • Tube movement / distortion
High Temp System Fundamentals Sacrificial protective shield at camera tip. High temperature capable lens system Fused glass boundary separates internal from external environment and allows for both WP and EXP system ratings.
Thermal Design • Correct installation is a critical component of the thermal design. • Location of lens tip back in the refractory minimizes the radiation and convective exposure and thus the heat load.
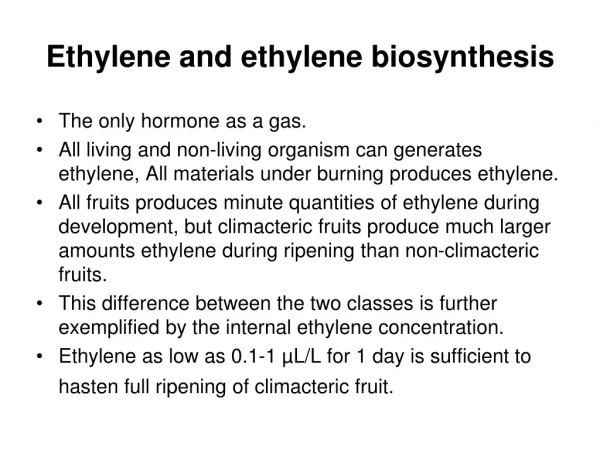
Thermometry Fundamentals • Objects radiate energy across a wide spectrum including the visible band (above ~1000 F) • As temperature increases the power curve shifts left toward the shorter wavelengths. • Measuring the intensity of radiation at any given wavelength reveals the temperature of the object (assuming emmissivity is known).
Short Spectrum Measurement • Intensity of radiation coming from an object is dependent upon its emmissivity. • Emmissivity is wavelength dependent and has a larger value at the shorter wavelengths. • If emmissivity changes over time, due to surface changes, it is more accurate to use short wavelength (visible) instrumentation in order to minimize the error.
Example of Emmissivity Error e at .6 micron = .8 (vision system) e at 3.9 micron = .4 (pyrometer) Selection of the exact value is difficult. If one Selects .75 for the vision system and .35 for the pyrometer, the error associated with each is: Vision - (.8 - .75) / .8 = 6.25% Pyrometer – (.4 - .35) / .4 = 12.5%
Installation and Calibration • Once the vision system is installed it remains stationary in relation to the inside of the furnace. • After initial calibration system does not require recalibration if it remains in place. • Initial calibration is done in reference to thermocouple or pyrometer reading.
Vision Features • Analysis of any portion of the screen. • Multiple analysis zones available • Can measure temperature, flame size or flame detection in any zone. Zone area is analyzed, not just one point. • Visual aspect of the technology allows operator to optimize detection settings. Measurement area is the same each time. • Visual verification of upset conditions.
Temperature Method • Camera technology can evaluate temperature in two ways; Intensity measurement or RGB calibrated. • In most cases intensity, especially over a short range, suffices. • Camera can also be calibrated to the CIE scale and measure by color (Wavelength).
Test Case Data • Previous slide shows an array of tubes with measurement zones overlaid. • Each zone has its own output, in this case it is intensity via the Y component of the Yab scale • The following slide shows repeatability of multiple thermal cycles. • Y scale is 0 – 255 and repeatability is generally better than 2%.
Rotary Kiln • The previous slide shows a live image next to a digitized image of the kiln. The flame capture is made by visually discerning the difference between flame and background and setting the image thresholds accordingly. • Image can produce a flame size or area as well as a temperature (Average or maximum)
Conclusion • Vision presents features and options that expand the capability of high temperature thermography. Visual confirmation of the system set up and results are enormous benefits in trusting data. Two dimensional capability of the system is also beneficial in assessing temperature on a locally average basis and not by a single point.