Download
1 / 29
290 likes | 403 Views
SPATIALLY RESOLVED MINUTE PERIODICITIES OF MICROWAVE EMISSION DURING A STRONG SOLAR FLARE. Kupriyanova E. 1 ,Melnikov V. 1 , Shibata K. 2,3 , Shibasaki K. 4. 1 Pulkovo Observatory, Russia 2 Kyoto University, Japan 3 Kwasan and Hida Observatory, Japan

E N D
SPATIALLY RESOLVED MINUTE PERIODICITIES OF MICROWAVE EMISSION DURING A STRONG SOLAR FLARE Kupriyanova E.1,Melnikov V.1, Shibata K.2,3, Shibasaki K.4 1 Pulkovo Observatory, Russia 2 Kyoto University, Japan 3 Kwasan and Hida Observatory, Japan 4 Nobeyama Solar Radio Observatory,Japan
Introduction 1. Until recent time, quasi-periodic pulsations (QPPs) with periods from 1 to 15 minutes have been observed in solar microwave emission above the sunspots only (Gelfreikh et al., Solar Phys., V.185, P.177, 1999). Last time, QPPs with that periods became to appear during the flares also. In the microwaves. They was discribed in the papers: Zaitsev et al., Cosmic Research, V.46, P.301, 2008;Meszarosova et al., Astron. Astrophys., V.697, P. L108, 2009; Sych et al., Astron. Astrophys., V.505, P.791, 2009;Reznikova, Shibasaki, Astron. Astrophys., V.525, P.A112, 2011; Kim et al., The Astrophysical Journal Letters, V. 756, P. L36, 2012 In X-rays, minute QPPs were studied byJakimiec and Tomczak (Solar Phys., V.261, P.233, 2010) Studies of these oscillations became especially topicalin view oftheir possiblerelationship to flare energyrelease and heating ofthe solar corona: Nakariakov and Zimovets, Astrophys. J.L., V.730. P.L27, 2011; Zaitsev and Kislyakova, Radiophys. Quant. El., V.55. P.429. 2012. The aim 2. Study of the spatial structure of QPPs with periods of several minutes in the microwave emission of the solar flare on May 14, 2013.
Methodology.Analysis of QPPs in Time Profiles 3. • 1. Time profiles of high-frequency component are calculated for each box using formula (1) HereF(t) is original flux (Stokes I or Stokes V) from a whole box, Fsm(t)is its low-frequency background obtained using method of running average with time intervals = 30500 s. • 2. The time profiles D(t) are studied using methods of correlation, Fourier and wavelet analysis. 3. For eacht : auto-correletion functions R(D) and their Fourier periodograms; wavelet spectra of D. Analysis of spatial structure of QPPs • 4. NoRH radio maps at 17 and 34 GHz are built (time cadenceis 1s); • 5. small boxes are selected in a different parts of flaring area; • 6. time profiles of the integrated fluxes are calculated for each box; • 7. the time profiles are studied using the method discribed in items 1-3.
4. Integrated (spatially unresolved) time profiles Fig. 1
Cross-correlations of NoRH and NoRP signals 4. Fig. 2 Fig. 3 • The time profiles of the NoRH correlation amplitudes are well correlated with NoRP integrated flux Fig. 1. Their cross-correlation function at 17 GHz are shown in Fig. 2 (upper panel), and that for 34 GHz(35 GHz) (downer panel). • The total time profiles (without detrending) of the NoRH correlation amplitudes are well correlated at frequences 17 GHz and 34 GHz (Fig. 3) with correlation coefficient r ≈ 1.0. • The total time profiles (without detrending) of the NoRP fluxes are well correlated at frequences 17 GHz and 34 GHz (Fig. 3) with correlation coefficient r ≈ 0.8.
5. Spectral properties of the integrated signal (correlation amplitudes) Phase of flare maximum01:06:30 – 01:08:00UT. QPPs with period 50 s are well pronounced at both frequincies. The time profile at 34 GHz delays relatively to time profile at 17 GHz by 12 s
6. Dynamic of the source of microwave emission Time profiles of emission fluxes intergrated over the whole area
6. Dynamic of the source of microwave emission Variance map Data cube is stable N = 1800 from 01:00:00 to 01:29:59 UT
7. Analysis of spatial structure of QPPs Flare maximum phase QPPs with P ≈1 min reveal obvious delays between time profilesfrom large loop relatively to time profile of the small loop
8. Spectral analysis of QPPs Spectral power From violet to orange lines t = 15, 30, 60, 90, 120, 150,180 s Periods detected: 50 s, 60 s, 100 s, 150 s 10 Period, s
9. Cross-correlation analysis of QPPs Spectral power The fluxes from box 1, box 2, and box 3 in the big loop delay with respect to the flux from box 0 in the small loop by Dt≈ 36–40 s 11
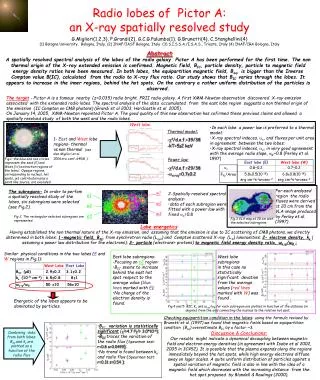
Observed periods Pobs ≈ 50–180 s T0 = 5·106―2107 K PSMAI ≈ 61–120 s L = 22 Mm n0 = 5·1010–1011 cm-3 PSMAII ≈ 32–60 s B0 = 300 G PSMAIII = 20–40 s a/L≈ 0.2 PSI does not exist Sausage mode Kink mode Slow magneto-acoustic mode PKI = 12–17 s PBI = 11–16 s PSII does not exist PKII = 6–9 s PBII = 6–8 s PSIII = 3–4 s Balloning mode PBIII = 4–6 s PKIII = 4–9 s Discussion. MHD-oscillations 10. Standing MHD modes trapped in magnetic tube.
Observed periods Pobs ≈ 50–180 s T0 = 5·106―2107 K PSMAI ≈ 173–245 s L = 40 Mm n0 = 5·1010–1011 cm-3 PSMAII ≈ 87–122 s B0 = 100 G PSMAIII = 58–82 s a/L≈ 0.2 PSI does not exist Sausage mode Kink mode Slow magneto-acoustic mode PKI = 65–92 s PBI = 63–89 s PSII does not exist PKII = 34–48 s PBII = 32–45 s PSIII = 15–21 s Balloning mode PBIII = 22–31 s PKIII = 24–33 s Discussion. MHD-oscillations 10. Standing MHD modes trapped in magnetic tube.
Periods observed 2 L P = nvph Pobs ≈ 1 min L — loop length n — harmonic number vph —phase velocity L,N0,B0,T0Ne, Be, Te L1= 40 Mm L2 = 22 Mm 10. Discussion. MHD oscillations. Standing waves? The periods can be caused by SMA mode of MHD oscillations in a loop The period of the standing MHD wave is: Dispersion equation for MHD mode in a simplest magnetic loop: But... Period is the samein the both loops
Observed periods The small loop: T0 = 5·106 K T0 = 2·107 K Pobs ≈ 1 min n0 = 5·1010 cm-3 n0 = 5·1010 cm-3 B0 =300 G B0 =300 G The fundamental PSMAI ≈ 61 s Second harmonic PSMAII ≈60 s Delays SMA waves D t ≈ 40 s DL vph ≈ 330–510 km/s T0 = 5·106–107 K n0 = 5·1010–1011 cm-3 B0 =100–300 G L = 40 Mm L = 22 Mm The big loop: DL≈ 16000 km DL = vph· Dt Induced oscillations 11. 15
Conclusions Spatially resolved quasi-periodic pulsations (QPPs) periods P = 50, 60, 100, 155, 180 s are found in microwave emission during solar flare on May 14, 2013. Data of Nobeyama Radioheliograph (NoRH) and Radio Polarimeters (NoRP) at 17 GHz and 34 GHz are used. The QPPs with the same period of P ≈ 1min originate from two flaring loops having different lengths L during the impulsive phase of the flare. These QPPs in the big loop delays over the QPPs from the small loop by Dt ≈ 40 s. The periods QPPs in the small loop correspond to the standing SMA mode. QPPs in the large loop are induced by oscillation of the small loop.
Thank you for your attention !
11. Slow magnetoacoustic waves in two-ribbon flares? But... The loop in the middle appears after the border loops
is time: i = 0..N–1,N is number of points in time series Testing the method 5. Amount of tests is 500 Model function : s s s
Testing the method 5. t = 15 s
t = 20 s Testing the method 5.
t= 25 s Testing the method 5.
t= 30 s Testing the method 5.
t= 40 s Testing the method 5.
Testing the method 5. Results for period >90 % >96 % >99 % >99 %