Download
1 / 44
440 likes | 554 Views
Multiple Regression I 4/9/12. Transformations The model Individual coefficients R 2 ANOVA for regression Residual standard error. Section 9.4, 9.5. Professor Kari Lock Morgan Duke University. To Do. Project 2 Proposal (due Wednesday, 4/11) Homework 9 (due Monday, 4/16)

E N D
Multiple Regression I • 4/9/12 • Transformations • The model • Individual coefficients • R2 • ANOVA for regression • Residual standard error Section 9.4, 9.5 Professor Kari Lock Morgan Duke University
To Do • Project 2 Proposal (due Wednesday, 4/11) • Homework 9 (due Monday, 4/16) • Project 2 Presentation (Thursday, 4/19) • Project 2 Paper (Wednesday, 4/25)
Transformations • If the conditions are not satisfied, there are some common transformations you can apply to the response variable • You can take any function of y and use it as the response, but the most common are • log(y) (natural logarithm - ln) • y (square root) • y2 (squared) • ey (exponential))
log(y) Original Response, y: Logged Response, log(y):
y Original Response, y: Square root of Response, y:
y2 Original Response, y: Squared response, y2:
ey Original Response, y: Exponentiated Response, ey:
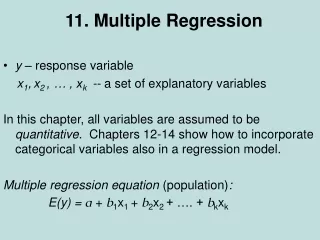
Multiple Regression • Multiple regressionextends simple linear regression to include multiple explanatory variables:
Grade on Final • We’ll use your current grades to predict final exam scores, based on a model from last semester’s students • Response: final exam score • Explanatory: hw average, clicker average, exam 1, exam 2
Grade on Final What variable is the most significant predictor of final exam score? Homework average Clicker average Exam 1 Exam 2
Inference for Coefficients The p-value for explanatory variable xi is associated with the hypotheses For intervals and p-values of coefficients in multiple regression, use a t-distribution with degrees of freedomn – k – 1, where k is the number of explanatory variables included in the model
Grade on Final Estimate your score on the final exam. What type of interval do you want for this estimate? Confidence interval Prediction interval
Grade on Final Estimate your score on the final exam. (hw average is out of 10, clicker average is out of 2)
Grade on Final Is the clicker coefficient really negative?!? Give a 95% confidence interval for the clicker coefficient (okay to use t* = 2).
Grade on Final Is your score on exam 2 really not a significant predictor of your final exam score?!?
Coefficients • The coefficient (and significance) for each explanatory variable depend on the other variables in the model! • In predicting final exam scores, if you know someone’s score on Exam 1, it doesn’t provide much additional information to know their score on Exam 2 (both of these explanatory variables are highly correlated)
Grade on Final If you take Exam 1 out of the model… Now Exam 2 is significant! Model with Exam 1:
Grade on Final If you include Project 1 in the model… Model without Project 1:
Multiple Regression • The coefficient for each explanatory variable is the predicted change in y for one unit change in x, given the other explanatory variables in the model! • The p-value for each coefficient indicates whether it is a significant predictor of y, given the other explanatory variables in the model! • If explanatory variables are associated with each other, coefficients and p-values will change depending on what else is included in the model
Residuals Are the conditions satisfied? (a) Yes (b) No
Evaluating a Model • How do we evaluate the success of a model? • How we determine the overall significance of a model? • How do we choose between two competing models?
Variability • One way to evaluate a model is to partition variability • A good model “explains” a lot of the variability in Y Variability Explained by the Model Total Variability Error Variability
Exam Scores • Without knowing the explanatory variables, we can say that a person’s final exam score will probably be between 60 and 98 (the range of Y) • Knowing hw average, clicker average, exam 1 and 2 grades, and project 1 grades, we can give a narrower prediction interval for final exam score • We say the some of the variability in y is explained bythe explanatory variables • How do we quantify this?
Variability • How do we quantify variability in Y? • Standard deviation of Y • Sum of squared deviations from the mean of Y • (a) or (b) • None of the above
Sums of Squares Variability Explained by the model Total Variability Error variability SST SSM SSE
Variability • If SSM is much higher than SSE, than the model explains a lot of the variability in Y
R2 Variability Explained by the Model Total Variability • R2 is the proportion of the variability in Y that is explained by the model
R2 • For simple linear regression, R2 is just the squared correlation between X and Y • For multiple regression, R2 is the squared correlation between the actual values and the predicted values
Is the model significant? • If we want to test whether the model is significant (whether the model helps to predict y), we can test the hypotheses: • We do this with ANOVA!
ANOVA for Regression k: number of explanatory variables n: sample size
Final Exam Grade For this model, do the explanatory variables significantly help to predict final exam score? (calculate a p-value). (a) Yes (b) No n = 69 SSM = 3125.8 SSE = 1901.4
Simple Linear Regression • For simple linear regression, the following tests will all give equivalent p-values: • t-test for non-zero correlation • t-test for non-zero slope • ANOVA for regression
Mean Square Error (MSE) • Mean square error (MSE) measures the average variability in the errors (residuals) • The square root of MSE gives the standard deviation of the residuals (giving a typical distance of points from the line) • This number is also given in the R output as the residual standard error, and is known as sin the textbook
Simple Linear Model Residual standard error = MSE = seestimates the standard deviation of the residuals (the spread of the normal distributions around the predicted values)
Residual Standard Error • Use the fact that the residual standard error is 5.494 and your predicted final exam score to compute an approximate 95% prediction interval for your final exam score • NOTE: This calculation only takes into account errors around the line, not uncertainty in the line itself, so your true prediction interval will be slightly wider
To Come… • How do we decide which explanatory variables to include in the model? • How do we use categorical explanatory variables? • What is the coefficient of one explanatory variable depends on the value of another explanatory variable?