Download
1 / 55
550 likes | 728 Views
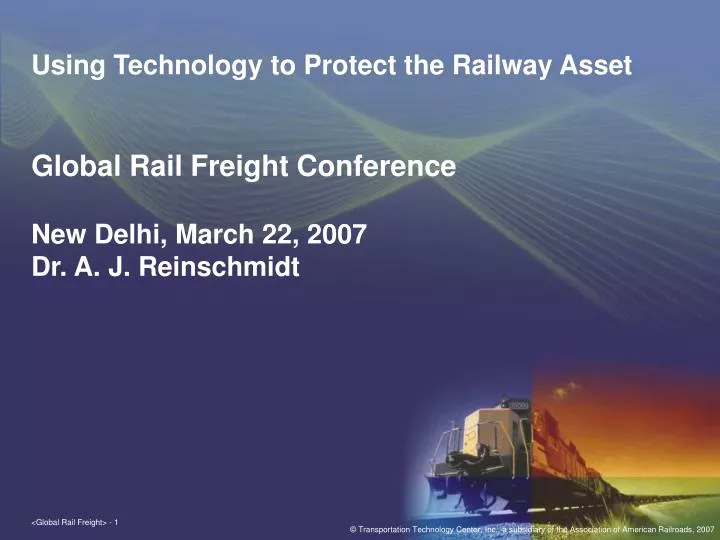
Using Technology to Protect the Railway Asset Global Rail Freight Conference New Delhi, March 22, 2007 Dr. A. J. Reinschmidt. TTCI and TTC: Two Different Things. TTC: The Facility. TTCI: The Company. The Transportation Technology Center, Inc. Our Landlord. Our Owner.

E N D
Using Technology to Protect the Railway AssetGlobal Rail Freight ConferenceNew Delhi, March 22, 2007Dr. A. J. Reinschmidt
TTCI and TTC: Two Different Things TTC: The Facility TTCI: The Company
The Transportation Technology Center, Inc. • Our Landlord • Our Owner
AAR - Association of American Railroads Represent 8 class 1 freight railroads (200,000 mile of trackage, 2.1 trillion ton-kilometers Freight Haulage) • Annual Revenues - $36 Billion dollars • Public policy advocacy • Network efficiency and interchange by electronic information exchange Anot-for-profit association, established in 1934
TTCI: The Company • Wholly owned subsidiary of the Association of American Railroads • Headquartered at TTC • Operated by our own management team • Guided by our own Board of Directors • Charged with developing TTC to become the worlds leading railway research testing and training facility
U.S. Freight Intercity Modal Market Share Pipeline 2% Water 1% Other 7% RRs 10% Pipeline 17% RRs 42% Water 13% Trucks 80% Trucks 28% Ton-Miles Revenue “Other” for ton-miles is less than 0.5%. Source: Eno Transportation Foundation
Class I Railroad Traffic in 2005 (Gross Freight Revenue) Intermodal* - $10.1 bil Coal - $9.4 bil Chemicals - $5.4 bil Transportation equipment - $4.0 bil Farm products (mainly grain) - $3.6 bil Food - $3.3 bil Lumber & wood - $2.3 bil Pulp & paper - $2.0 bil Primary metal products (e.g., steel) - $1.7 bil Stone, clay & glass products (e.g., cement) - 1.5 bil Nonmetallic minerals (e.g., sand, gravel) - $1.3 bil Source: AAR *Estimated. Some intermodal revenue is also included in individual commodities.
Intermodal is Now the Top Class of U.S. Freight Rail Traffic Intermodal and Coal as a % of Revenue* *Data for BNSF, CSX, KCS, NS, and UP Source: railroad financial reports
Railroads Are Moving More Traffic Today Than Ever Before U.S. Rail Traffic: % Change From Previous Year – Q1-01 to Q2-06 Intermodal Carloads Source: AAR Weekly Railroad Traffic
U.S. Rail Ton-Mile Growth: 1964-2005(Index 1981 = 100) Staggers Act Passed Oct. 1980 Source: AAR
U.S. Class I Tons Originated(billions) Source: AAR
Railroad Traffic Density is Rising Millions of Class I Ton-Miles Per Mile of Road Owned Source: AAR
Railroads are Safe and Getting Safer RR Safety Trends: 1980-2005 (1980 = 100) Source: FRA, AAR
RRs Are Safer Than Other Industries Cases With Days Away From Work, Job Transfer, or Restriction Per 100 Full-Time Workers - 2004 Avg. All Private Industry Trucks Constr. Avg. Mfg. Source: U.S. Bureau of Labor Statistics
Railroads Have Been Increasing Spending for a Long Time... Class I Spending* on Infrastructure & Equipment Per Mile of Road Owned Trend line *Capital spending + maintenance expenses - depreciation Source: AAR
...And Are Poised to Spend Even More Class I RR Capital Expenditures ($ Billions) e – AAR estimate Source: AAR
RRs Have Far Higher Capital Expenditures Than Other Industries Capital Expenditures as a % of Revenue: Avg. 1995-2004 Class I RRs Petrol. & Coal Prod. Computers Avg. All Mfg. Plastics Transp. Equip. Nonmet. Minerals Food Chemicals Wood Prod. Paper Sources: U.S. Census Bureau, AAR
EFFICIENCYRailroad Spending TrendsTotal Spending = 37.7 Billion Source: Class I railroad (R-1 data) 2004. Spending is independent of depreciation expense.
Railroad Spending TrendsRoadway (MOW) Track Related Spending Source: Class I railroad (R-1 data) 2004.
Anatomy of Track Strength Typical Curve Spirals Mainline Track Track Transitions Special Trackwork Poor Foundations New Construction Bonded Track on IJs Bridges 3091-Davis-1
Anatomy of Train Loads Steering Trucks Heavy Curves Bad Actor Trucks Tangent Track Track Transitions Special Trackwork 3091-Davis-2
Forces From Train Potential Problems Methods of Reducing the Stress State Strengthen all track (e.g. Rail Steels) Fix weak points Better (Dynamically Designed) track Match track strength to train loads
Forces From Train Potential Problems Methods of Reducing the Stress State Strengthen all track Fix weak points (e.g. Rail Welding) Better (Dynamically Designed) track Match track strength to train loads
Potential Problems Methods of Reducing the Stress State Strengthen all track (Capital Intensive) Fix weak points Better (Dynamically Designed) track (e.g. STW) Match track strength to train loads Forces From Train
Methods of Reducing the Stress State Strengthen all track (Capital Intensive) Fix weak points Better (Dynamically Designed) track Match track strength to train loads (e.g. TOR) Forces From Train Strengthof Track Where train is applying high forces, track is strong.
Inspections with Existing Technologies • Truck Curving (TPD) • High Lateral Loads • High L/V Ratio • High Angle of Attack • Acoustic Bearing Detector (TADS) • Smart HBD’s • Machine Vision Based Inspection Systems (FactIS)
Truck Performance Detector Site N.A. Freight – 18 TPD Installations
Trackside Acoustic Detector Site N.A. Freight – 8 TADS Installations
Example: Inner Ring or Cone Defect Time history and frequency spectrogram Sound file for cone defect
Example: Outer Ring or Cup Defect Time history and frequency spectrogram Sound file for cup defect
Example: Roller Defect Time history and frequency spectrogram Sound file for roller defect
Wheel Profile Condition Monitoring 3 FactISTM Sites in North America
Cracked Wheel Detection Problems: • Annual costs related to cracked railroad wheels is approximately $24 million • Thermal cracks and shattered rim cracks account for many derailments • Problem continues to grow under HAL Goals: • Develop a wayside inspection system • Reduce derailments resulting from broken wheels • Develop new wheel alloys Accomplishments to date • Developed and demonstrated effectiveness of a wayside cracked wheel detection system • Hospital and FAST train tests
SRI 6A Cracked Wheel Detection Conceptual Operation Cracked Wheel Detection Wayside Tracking System
SRI 6A Cracked Wheel Detection Actual Operation Cracked Wheel Detection Wayside Tracking System
Cracked Wheel Detection - Results Pattern Recognition A-Scan Electronic Strip Chart Service Flaw Indications Artificial Flaw Indications Artificial and Service Flaw Indications
HAL Axle Program • Problem: • Derailments due to broken axles have increased over the past 4 to 5 years • Approximately 20 broken axles per year in the 2000’s as compared to 4 in the late 1990’s • Problem Size is $15M+ • Goals: • Determine the ability of currently designed 286,000-lb Class F axles to survive in the railroad environment • Reduce/eliminate derailments caused by broken axles • Research Approach • Multi-faceted program focused on both prevention and detection • Prevention – New axle designs? • Detection – Laser ultrasonics
Cracked Axle Detection Beam Turning and Shaping Air-Coupled Transducers Wheel Sensors Indexing Mirrors Turning Mirrors Laser Heads
Prototype System No Crack Present Direct Wave Amplitude Time (microseconds) Crack Present Reflected Wave Direct Wave Amplitude Time (microseconds)
Cracked Axle Inspection System • No Crack Condition • Primary wave detected at ~1130 microseconds • Calculated primary wave for a 36-inch wheel is ~1145 microseconds • No crack reflection present Direct Wave Optic Base Station Beam Expander Direct Wave Axle Inspection Station Direct Wave Direct Wave Reflected Wave Reflected Wave • Crack Condition • Crack located 89 mm from axle centerline • Calculated primary wave for a 38-inch wheel is ~1265 microseconds • Crack reflection expected at 1339 microseconds • Crack reflection observed at 1340 microseconds
ATSI & EHMS Steering Committee – Mission • Provide overall leadership and governance for the industry’s Advanced Technology Safety Initiative and Equipment Health Management Systems (EHMS)
ATSI & EHMS – “Changing Finders into Fixers” • Develop shared responsibility for car condition • Railroads • Private Car Owners • Maintenance Responsible Parties • Use detector data to identify distressed cars and assess level of distress • Issue notifications to maintenance reponsibile party to affect repair
2006 Accomplishments • Worked in conjunction with the AAR’s Equipment Engineering Committee & the SRI Program to develop criteria for truck hunting performance • Developed consensus on 2007 – 2008 detector focus • Bearings – Acoustic detection and temperature trending • Vision systems for wheel profile and brake shoes • Imbalanced / overloaded car detection
2007 Activities and Focus Areas • Rule 88 Examination • When in the car owners control, are all appropriate conditions identified and repaired? • Home Shopping • How can the industry work together to efficiently identify and remediate cars that need extensive repair? • Interface with Other AAR Activities • How can ATSI & EHMS support other related AAR initiatives?
ATSI & EHMS Technology Roadmap • Wheel Profile • Data in InteRRIS® – late ’06 • Remediation recommendation – ’07 • Rules not specific to wayside detection systems • Truck Performance • Data in InteRRIS® – ’02 • Remediation recommendation – late ‘07 • Overload / Imbalance • Base data in InteRRIS® – ‘01 • Additional work needed for alarming (SRI Program in ’07) • Remediation recommendations – ‘09
ATSI & EHMS Technology Roadmap • Hot / Cold Wheel • Data in InteRRIS® – Ready to accept data • Remediation recommendation – ‘09 • Brake Shoe – Visual • Data in InteRRIS® – ’08 • Remediation recommendations – prior to ’10 • Rules not specific to wayside detection systems • Vision Systems • Data in InteRRIS® (beyond WPMS) – ’08 • Remediation recommendation – ’10
ATSI & EHMS Roadmap • Technology Driven Train Inspection • Data in InteRRIS® – Early ’08 • Remediation recommendation – ‘11 • Cracked Axle • Data in InteRRIS® – ‘10 (est) • Remediation recommendation – prior to ’11 • Cracked Wheel • Data in InteRRIS® – ’09 • Remediation recommendations – ‘13