1 / 0

Financial Reporting Module

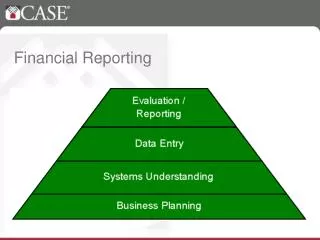
EMBA 512 Assessing Business Opportunities. Financial Reporting Module. Objective of this Module. Assist you in becoming more sophisticated in your understanding and use of financial statements what’s the link to opportunity assessment?

seth
Download Presentation

Financial Reporting Module

An Image/Link below is provided (as is) to download presentation Download Policy: Content on the Website is provided to you AS IS for your information and personal use and may not be sold / licensed / shared on other websites without getting consent from its author. Content is provided to you AS IS for your information and personal use only. Download presentation by click this link. While downloading, if for some reason you are not able to download a presentation, the publisher may have deleted the file from their server. During download, if you can't get a presentation, the file might be deleted by the publisher.

E N D

Presentation Transcript


  1. EMBA 512Assessing Business Opportunities

    Financial Reporting Module

  2. Objective of this Module Assist you in becoming more sophisticated in your understanding and use of financial statements what’s the link to opportunity assessment? financial accounting provides much of the information by which prospects are measured Complex area focus of a semester long course
  3. The Accounting System Provides information for many financial decisions internal users (managerial accounting) planning control external users (financial accounting) investing lending customer/supplier negotiations labor negotiations
  4. The Financial Statements Balance Sheet statement of financial position (moment in time) assets--the valuable resources of a company subject to GAAP measurement conditions liabilities--the claims of outsiders to the resources subject to GAAP measurement conditions equity--the residual that belongs to the owners Fundamental asset characteristics: a future benefit controlled by the company flowing from a past transaction
  5. Google, Inc.’s Balance Sheet All numbers in thousands December 31 2009 2008
  6. The Financial Statements Income Statement (P&L) summarizes performance for a past period revenues--asset inflows from operations expenses--asset outflows for operations gains--net inflows from nonoperating items losses--net outflows for nonoperating items
  7. Google, Inc.’s Income Statement All numbers in thousands
  8. The Financial Statements Statement of Cash Flows summarizes flows for the period by type operating typically prepared indirectly investing purchases and sale of ‘capital’ investments financing transactions with creditors and owners
  9. Google, Inc.’s Statement of Cash Flow All numbers in thousands
  10. E3.13
  11. P3.26
  12. The Accrual Model Financial statements are built from a company’s transactions record assets and liabilities revenues and expenses from the changes in them The ever present accounting equation A = L + SE
  13. P2.23
  14. E2.16
  15. E2.17
  16. Key Accounting Method Choices Can dramatically impact reported results inventory depreciation research and development consolidations
  17. Inventory Cost Flow Example ABC Company’s inventory transactions: 1/01/x1--buys 1 unit @ $10 1/12/x1--buys 1 unit @ $12 1/21/x1--sells 1 unit @ $20 ABC Company’s Performance: inventory (B/S)CGS(I/S) FIFO 1 @ $12 = $12 $10 LIFO 1 @ $10 = $10 $12
  18. Inventory Method Choice Summary MethodInventory(B/S)Cost of Goods Sold(I/S) FIFO current prices old prices LIFO old prices current prices Financial Statement Impact (assuming rising prices) Balance Sheet Inventory FIFO > LIFO Income Statement Cost of Goods Sold FIFO < LIFO Net Income FIFO > LIFO
  19. Depreciation of Property, Plant and Equipment Process of allocation, not valuation charge a portion of the cost to expense during each year of an asset’s useful life income statement shows depreciation expense balance sheet shows accumulated depreciation Amount of depreciation taken depends on: cost method (straight-line, accelerated) salvage value life
  20. Why Might Depreciation Vary Across Companies? Method differences most U.S. firms use SL can convert SL to accelerated (MACRS) using income tax footnote Life differences (for companies using SL) average life = gross PP&E ÷ annual depr. exp. Age differences (for companies using SL) average age = accumulated depreciation ÷ annual depr. exp.
  21. Research and Development Activity directed at developing new knowledge translate into products services processes Sometimes successful, often not tangible evidence of success patents trademarks profits!
  22. The Challenge of R&D When money is spent up front, how do we evaluate it’s future success? Necessary in order to capitalize (record as asset) the successful expense (write off) the rest GAAP’s solution expense all R&D conservatism
  23. Assume: R&D spending is constant @ $10,000/year Creates benefits lasting 5 years Company has $100,000 of assets and $25,000 of income, both before considering R&D Required: Evaluate the impact of expensing R&D on Return on Assets (ROA) The Conservatism Paradox
  24. The Conservatism Paradox
  25. Analyzing R&D Firms Need to exercise care in interpreting profitability especially when level of R&D expenditures is changing
  26. Consolidated Financial Statements Consolidate holdings in excess of 50% of voting shares financial statements of affiliates combined as though a single legal entity tax reporting--may be separate or combined tax returns
  27. Consolidations Two methods pooling of interests commingling of existing interests Book value (BV) basis of both affiliates maintained in consolidated statements purchase acquisition of one company by another subsidiary’s assets and liabilities remeasured at fair value at date of combination goodwill
  28. Consolidation Methods Change in GAAP in 2001 (SFAS 141) prohibits new poolings prior poolings left unchanged subsequent action modified the purchase accounting rules goodwill is no longer amortized still recorded as an asset written down (off) only if impaired
  29. Impact of Consolidation on Financial Statements Income Statement Net income pooling > purchase Balance Sheet Total assets---------purchase > pooling Total liabilities-----purchase = pooling Total equity---------purchase > pooling
  30. Other Consolidation Issues Noncontrolling interest (minority interest) stock of subsidiary owned by outsiders creates outside claims on assets minority interest in net assets (liability/equity) income minority interest in income (pseudo expense)
  31. Other Consolidation Issues Consolidation of unconsolidated subsidiaries (those just below 50%) happens occasionally but not common very suspicious reported using equity method would like them to be consolidated (controlled) income statement--net income is o.k. balance sheet--subsidiaries debts are left off the books can adjust data using footnote disclosures very involved adjustments
  32. Financial Statement Analysis For what purpose? price arbitrage lending customer/vendor evaluation labor negotiations government regulation litigation support
  33. Financial Statement Analysis What are we looking for? Positive investment returns! Rt = (Pt + Dt – Pt-1) / Pt-1 Where Pt = Share price at end of period, Dt = Dividends received during the period, Pt-1 = Share price at beginning of period What are we worried about? Risk!
  34. E1.29
  35. Financial Statement Analysis Factors affecting corporate performance industry characteristics (Porter’s five forces) buyer power (price sensitivity) costliness, competing products supplier power scarcity, quantity rivalry among firms threat of new entrants capital intensity, government regulation, rate technological change threat from substitute products Bargaining Power Competition
  36. Financial Statement Analysis Factors affecting corporate performance industry characteristics (Porter’s five forces) corporate strategy product focus differentiation, low cost leadership, niche ● location in the value chain manufacturing, distribution, integration diversification (geographic or industry) leverage use of financial and/or operating leverage
  37. The Margin versus Turnover Trade-Off
  38. Financial Statement Analysis Factors affecting corporate performance industry characteristics (Porter’s five forces) corporate strategy product focus differentiation, low cost leadership, niche location in the value chain manufacturing, distribution, integration diversification (geographic or industry) leverage use of financial and/or operating leverage
  39. Operating Leverage Illustration ABC Company plans to sell a new product this year that can be sourced two ways: subcontract to Asia for a cost of $1.50 each. produce in a refurbished company owned facility at a variable production cost of $1 and facility operating costs of $275,000/year What is product cost? Option 2 $775K ($1.55/unit) $1,075K ($1.34/unit) Option 1 $750K ($1.50/unit) $1,200K ($1.50/unit) at 500,000 units at 800,000 units
  40. Financial Leverage Illustration Company has $1,000 asset earning $150 (15%) before financing asset financed as follows: $300 by long-term debt (10% interest cost) $700 by equity ROA = (150 ÷ 1,000) = 15% ROCE = (120 ÷ 700) = 17% Assets provided by creditors: Return generated $300 x .15 = $45 Financing cost $300 x .10 = $30 $15 excess to equity
  41. Gauging Performance Ratios are popular performance measurement ROA, ROCE risk assessment extent to which current profits may be different that those in the future liquidity solvency turnover leverage (operating, financial)
  42. Identify the Company
  43. Complications Financial Statements tell us… only part of the story hard to predict the future fundamental challenge of analysis limitations in GAAP substantial latitude in preparing information discretionary accounting choices important information left off the statements ‘off-balance-sheet” financing
  44. Psychology of Reporting Management’s natural desire to cast things in a favorable light management vs. manipulation why we have GAAP audits millennium scandals why we now have Sarbanes/Oxley Act 404 PCAOB
  45. Financial Statement Analysis Performance measurement framework profitability (DupontModel—see p. 125) ROA profit margin asset turnover ROE ROA financial leverage risk solvency risk operating leverage financial leverage see ratio list
  46. Financial Statement Analysis Our focus is on the future to predict well we need to consider current economic conditions and forecasts industry characteristics company strategy
  47. Measuring Earnings Need to evaluate the components of GAAP income permanent earnings (recurring, persistent) transitory earnings
  48. Finding the Nonrecurring (Transitory) Earnings Sales -Cost of goods sold Gross profit - Operating expenses Income from operations + Other revenues/gains - Other expenses/losses Income before taxes - Income tax expense Net Income
  49. Nonrecurring Earnings Other Revenue/Gains gains from peripheral activities (e.g., the sale of PP&E, investments) Other Expenses/Losses losses from peripheral activities (e.g., the sale of PP&E, investments) restructuring charges impairment losses
  50. Other Sources of Nonrecurring Earnings Sales -Cost of goods sold Gross profit - Operating expenses Income from operations + Other revenues/gains - Other expenses/losses Income before taxes - Income tax expense Income before …
  51. Special Income Statement Items Discontinued Operations Extraordinary Items
  52. Discontinued Operations Results from disposal of segment a sizable component of operations Reported in two separate components income/loss on operations gain/loss on disposal Both components reported net of related tax effects
  53. O’Sullivan Corporation Manufacturer of flexible vinyl sheeting automotive, industrial, medical sold consumer products business in 2005 2005 Income b/4 Disc. Operations 8,813,858 Loss from operations (net of $428,489 in tax benefits) - 593,593 Loss from disposal (net of $1,825,954 in tax benefits) -3,674,046 Net Income 4,546,219
  54. Extraordinary Items Both unusual in nature and nonrecurring fire, flood and other casualties Reported net of related tax effects flood loss 1,000,000 tax effect (400,000) net loss 600,000
  55. E3.19
  56. Other Earnings Reporting Issues Restatements change amounts in financial statements for prior years (comparative statements) Used for correcting errors on prior years’ income statements reporting changes in accounting principles retrospective method changes in the entity (acquisitions, divestitures)
  57. Restatement Example XYZ Co. began operations in 2002 in 2002 recorded cost of a $100,000 building as a purchase of land. error not detected until this year (2006) building has a 20 year life and $0 salvage value. company uses straight-line depreciation. tax rate = 40%
  58. Restatement Example (Cont.) Income Statement20022003200420052006 depreciation taken 0 0 0 0 0 correct depreciation 5 5 5 5 5 gross effect on inc. - 5 - 5 - 5 - 5 - 5 taxes (40%) +2+2+2+2+2 net effect on inc. - 3 - 3 - 3 - 3 - 3 Corrections on Income Statement: NI (as previously reported) 41 45 -- error -3-3 -- NI (corrected) 38 42 47 Corrections on Statement of Retained Earnings: -6
  59. Restatement Example (Cont.) XYZ’s 2006 Financial Statements Income Statement:2004 2005 2006 depreciation expense 5.0 5.0 5.0 Net Income 38* 42* 47 *restated Statement of Retained Earnings: 2004 2005 2006 beg. balance xxxx xxxx xxxx prior period adjustment -6.0 0.0 0.0 adjusted beg. balance xxxx xxxx xxxx + net income 38.0 42.0 47.0 - dividends xxxxxxxxxxxx ending balance xxxx xxxx xxxx
  60. Overcoming GAAP Limitations Many accounting standards provide opportunities for managing income off-balance sheet financing (OBSF) Why would managers want to do this? basic economics we are all self interested agents agency costs Q1.13 Q3.6 Why would GAAP permit managers do this this? PEAP, POOP, WYWAP
  61. Not GAAP but… Politically Expedient Accounting Principles Concessions, concessions, concessions! Footnote reporting of option expense Pensions (triple smoothing of volatility) Whatever You Want Accounting Principles GAAP allow lots of choices FIFO/LIFO Accelerated/St. line
  62. Not GAAP but… Pitifully Old and Obsolete Principles Many old standards still around: Treasury stock (1934) – Stock splits (1941) Depreciation (1946) – Inventory (1947) – LT contracts (1955) – Quarterly reporting (1934)
  63. Fixing Up Poor GAAP Measurement Major problem areas investments (smoothing) leases (OBSF) retirement benefits (smoothing, OBSF) Details forthcoming in our next session (Saturday, February 16, 2013)
More Related