Download
1 / 24
240 likes | 351 Views
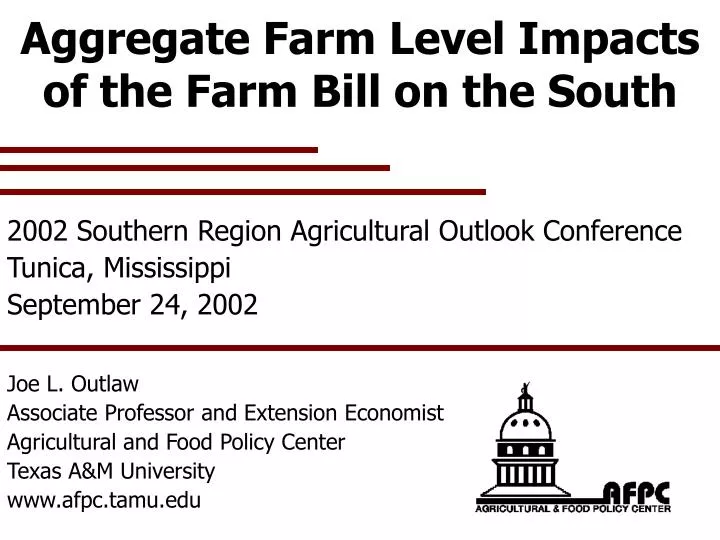
A ggregate Farm Level Impacts of the Farm Bill on the South. 2002 Southern Region Agricultural Outlook Conference Tunica, Mississippi September 24, 2002. Joe L. Outlaw Associate Professor and Extension Economist Agricultural and Food Policy Center Texas A&M University www.afpc.tamu.edu.

E N D
Aggregate Farm Level Impacts of the Farm Bill on the South 2002 Southern Region Agricultural Outlook Conference Tunica, Mississippi September 24, 2002 Joe L. Outlaw Associate Professor and Extension Economist Agricultural and Food Policy Center Texas A&M University www.afpc.tamu.edu
Assumptions for 2002 – 2007 Analysis of Farm Bill Impacts • Continuation of 2002 Farm Bill through 2007 • No more Market Loss Assistance payments after 2001 • Farmers update base and yields to maximize government payments • Farms structured so payment limits are not binding • FAPRI July 2002 Baseline provides • Average annual prices • Inflation rates for purchased inputs • Interest rates • Inflation rates for land • Historical yield and price risks used to incorporate risk.
Initial Debt Levels on Farms • Representative farms borrow all of their operating capital. • Real estate debt on January 1, 2001 assumed to be: • 20% Feed grains • 20% Wheat • 20% Cotton • 20% Rice • 30% Dairy • 1% Beef cattle • 35% Hogs • Machinery and livestock debt is 20% for all farms.
Representative Farms and Ranches Used for the Analysis of the 2002 Farm Bill Dairy Wheat Dairy Wheat Cattle Dairy Cattle Dairy Dairy Dairy Dairy Dairy Feed Grain Hog Cattle Rice Hog Feed Grain Hog Cattle Feed Grain Wheat Wheat Feed Grain Cotton Cattle Dairy Cattle Wheat Rice Cotton Dairy Feed Grain Hog Cattle Feed Grain Rice Cotton Feed Grain Rice Cotton Rice Dairy Dairy Cotton Dairy Cotton Cotton Dairy Dairy Cotton Rice Cotton Dairy Feed Grain Dairy Cotton Rice Rice Cattle Cotton Dairy
Definition of Output Variables • Probability of Cash Flow Deficits – chance that net cash farm income is less than family living, taxes, principal payments, and machinery replacement costs. • Probability of Losing Real Net Worth – chance that net worth, adjusted for inflation, is less than net worth at the end of 2001.
Definition of Overall Financial Position • Good – Less than 25% chance of cash flow deficits and losing real net worth. • Marginal– A 25 - 50% chance of cash flow deficits and losing real net worth. • Poor – Greater than 50% chance of cash flow deficits and losing real net worth.
REPRESENTATIVE FARMS PRODUCING FEED GRAINS IA NE MON MOC TN TXNP SC TXB
Economic Viability of Representative Feed Grain Farms Under Continuation of the 1996 Farm Bill
Economic Viability of Representative Feed Grain Farms Under Continuation of the 2002 Farm Bill
REPRESENTATIVE FARMS PRODUCING COTTON CA NC TN AL AR TXSP LA TXRP GA TXB TXCB
Economic Viability of Representative Cotton Farms Under Continuation of the 1996 Farm Bill
Economic Viability of Representative Cotton Farms Under Continuation of the 2002 Farm Bill
REPRESENTATIVE FARMS PRODUCING RICE CA MO ARH ARM MS LAN TX LAS TXE TXB
Economic Viability of Representative Rice Farms Under Continuation of the 1996 Farm Bill
Economic Viability of Representative Rice Farms Under Continuation of the 2002 Farm Bill
REPRESENTATIVE FARMS PRODUCING MILK WA VT NYC MIC NYW ID WI MIE CA MO TXN GAN TXE NM GAS TXC FLN FLS
Economic Viability of Representative Dairy Farms Under Continuation of the 1996 Farm Bill
Economic Viability of Representative Dairy Farms Under Continuation of the 2002 Farm Bill
REPRESENTATIVE FARMS PRODUCING HOGS IA IL IN NC
Economic Viability of Representative Hog Farms Under Continuation of the 1996 Farm Bill
Economic Viability of Representative Hog Farms Under Continuation of the 2002 Farm Bill
Comparison of 1996 Farm Bill to 2002 Bill for Southern Crop Farms
Comparison of 1996 Farm Bill to 2002 Bill for Southern Livestock Farms
Conclusions • Relative to December 2001 Baseline • Significant improvement in economic viability across all crop farms • Still considerable cash flow pressure • Very little pressure on equity as land values stem the slide • Improvement in economic viability of dairy operations • Considerable cash flow pressure • Some equity pressure • Hog operations marginally worse • Considerable cash flow pressure