Download
1 / 24
250 likes | 534 Views
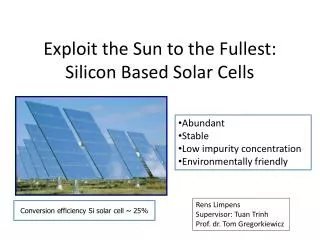
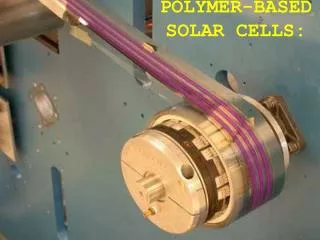
Gunmetal-based Solar Cells: Estonia’s contribution to save the world ?. Dieter Meissner Prof. for Sustainable Energetics Institute of Materials Science Tallinn University of Technology. TED x Tallinn 2011 April 18, 2011. Happy Life. in use since > 25 years.

E N D
Gunmetal-basedSolar Cells:Estonia’s contributionto save the world ? Dieter Meissner Prof. for Sustainable Energetics Institute of Materials Science Tallinn University of Technology TEDx Tallinn 2011 April 18, 2011
Happy Life in usesince > 25 years D. Meissner
Ecological Footprint analysis WWF Living Planet Report 2010 The ecological footprint concept and calculation method was developed as the PhD dissertation of Mathis Wackernagel, under Prof. William E. Rees at the University of British Columbia in Vancouver, Canada, from 1990-1994. Originally, Wackernagel and Reescalledtheconcept "appropriatedcarryingcapacity" Wikipedia: http://en.wikipedia.org/wiki/Ecological_footprint D. Meissner
Ecological Footprint by country per person Ecological Footprint per person, by country. This comparison includes all countries with populations greater than 1 million for which complete data are available. Source: EcologicalFootprint Atlas 2010 D. Meissner
Global Ecological Footprint The footprint is shown as number of planets. Total biocapacity, represented by the flat green line, always equals one planet Earth, although the biological productivity of the planet changes each year. Hydropower is included in built-up land and fuelwood in the forest component. Source: (EcologicalFootprint Atlas 2010) D. Meissner
CO2 concentrations: the last 500 million years Data from Vostok Ice Core herecultureourdeveloped (all knownhistory) 300 ppmv homo „sapiens“ Broken Hill Skull, Sambia 185 ppmv D. Meissner
Global Climate Change Temperature change 1946 - 2008 at thetwo hemispheres. The last 1000 years The global temperature 1880 - 2008 Source: T.S. Ledleyet al., EOS 80, 453 (1999) Ref.: „Lennart Bengtsson: „Status of climatechange res.“, presented at: „Energy 2050“, Int. Symp., Stockholm, 19-2o Oct. 2009, http://energy2050.se/ D. Meissner
Atmospheric CO2 concentrations • Measurementperformed at • Barrow, Alaska • Mauna Loa, Hawaii • American Samoa • South Pole, • Antarctica Ref: [1] AtmosphericCarbon Dioxide Recordfrom Mauna Loa, http://en.wikipedia.org/wiki/Carbon_dioxide [2] CCGG ObservatoryMeasurements, NOAA/ESRL's Global Monitoring Division (formerly CMDL) of the National Oceanic and Atmospheric Administration, Feb. 8, 2011, http://www.esrl.noaa.gov/gmd/ccgg/insitu.html D. Meissner
Atmospheric CO2 concentrations 500 ppmv 550, 750, 1000 ppm? 400 ppmv 300 ppmv What level is sustainable and which rate of change can our world’s ecosystems survive? 185 ppmv D. Meissner
Where will we go? “The atmospheric CO2 concentration currently is 390 parts per million by volume (ppmv), and continuing on a business-as usual path of energy use based on fossil fuels will raise it to ~900 to 1100 ppmvby the end of this century. ... warmed the tropics by 5° to 10°C and the polar regions by even more (i.e., 15° to 20°C). ... What can we learn from Earth’s past concerning the climate’s sensitivity to greenhouse gas increases? ... The human species and global ecosystems will be placed in a climate state never before experienced in their evolutionary history and at an unprecedented rate. Note that these conclusions arise from observations from Earth’s past and not specifically from climate models. Will we, as a species, listen to these messages from the past in order to avoid repeating history?” J. Kiehl, Science 331 (2011), 158 D. Meissner
Growth Estimates M. I. Hoffert et. al., Nature, 1998, 395, 881 2011: 7 bill.* • “It’s hard to make predictions, especially about the future” • M. I. Hoffert et. al., Nature, 1998, 395, 881: • “Energy Implications of Future Atmospheric • Stabilization of CO2 Content” • adapted from IPCC1992Report: Leggett, J. et. al. in • Climate Change, The Supplementary Report to the • Scientific IPCC Assessment, 69-95, Cambridge Univ. • Press, 1992 X Population Growth to 10 - 11 Billion People in 2050 Optimistic Muchtoo Optimistic 2010: 10,7** X Per Capita GDP Growth at 1.6% yr (US eia estimate: 3.2%/a at least until 2035***) Energy consumption per Unit of GDP declines at 1.0% yr -1 Actual data from: *Dt. StiftungWeltbevölkerung: http://www.weltbevoelkerung.de, 16.9.10 , **Wikipedia: http://en.wikipedia.org/wiki/World_economy, 16.9.10, *** US eia, http://www.eia.doe.gov/oiaf/ieo/world.html, 17.4.2011 D. Meissner
Power and Energy Units Energy: 1 J = 1 W for 1 s 1015 J = PJ 1018 J = EJ 1TW = 31,5 EJ/a 1 103 106 109 1012 Power 1 W1 kW 1 MW 1 GW 1 TW D. Meissner
World Power Supply Scenarios Possible development of power consumption and upper limits for the use of fossil fuels in order to limit CO2-levels to certain maximum values. Source: M. I. Hoffert et al., Nature 319 (1998), 881 2050: 12 TW CO2-free to stabilize (at or above 750 ppm) 2050: > 30 TW needed to stabilize at todays level 12 TW CO2-free X 2005:16 TW 1990: 11 TW 2050: 28 TW D. Meissner
Need for CO2-free Power Amounts of CO2-free power needed to provide mankind with sufficient power while keeping CO2-levels below certain limits. 30 TW X X 10 TW – 750 ppm Source: Source: M. I. Hoffert et al., Nature 319 (1998), 881 D. Meissner
Message M. I. Hoffert et. al., Nature, 1998, 395, 881 In 2050 the world needs at least 10 to 30 TW of CO2-free power D. Meissner
Growth Rates of Renewable Energy Technologies Average annual growth rates of renewable energy capacity, 2000 – 2004. An annual growth of 25 to 30 %/a for PV and wind must continue the next 40 years to go from 2 GWe in 2007 to 10 - 30 TW in 2050 ! D. Meissner
Solar Land Area Requirements Source:N. S. Lewis: „Global Energy Perspective“, http://nsl.caltech.edu/energy.html 6 Boxes at 3.3 TW (354 km)2 each would generate 20 TW D. Meissner
PV Learning Curve If an annual growth of 20 to 30 %/a for PV continues the next 40 years we can go from 2 GWe in 2007 to 10 - 30 TW in 2050 ! 1 MWp 1 GWp 1 TWp Source: P. Mints; „Thin Film Technologies: 2010 and Beyond “, Thin Film Solar Summit, Berlin, March 17-18, 2010 D. Meissner
Feedstock Problems 1 TWp/a needs 6 Mio. t/a 200.000 t/a 50.000 t/a 30.000 t/a Source: I. A. Schwirtlich, P. Lechner, H. Nagel, Schott Solar: „Technology benchmark of amorphous and crystalline Si-PV“, EPIA Industry Forum, 23rd European Photovoltaik Solar Energy Conference, Valencia September 3rd 2008, http://81.188.5.189/fileadmin/EPIA_docs/documents/23EUPVSEC/Presentations/IF_3_1_Schwirtlich.pdf D. Meissner
Gunmetal Swords to Ploughshares or even better: (or Estonian Crown, CuZnSnalloy) conversion Sculpture by Evgeniy V. Vuchetich in Kiev in front of the UN Headquarter, New York to Solar Cells Cu2ZnSnS2Se2 THE New PV Material, TUT’s solar cell material D. Meissner
TUT / crystalsol‘s Monograin Membranes Monograin Membrane Monograin Membrane Solar Cell Microscope Image (Ø 5 cm) Microscope Image (0.6 x 0.8 mm2) D. Meissner
Powder Production and Roll-to-Roll Process Powder production asdf Roll-to-roll production process Production of semicon-ductor powder Front contact Front sealing Powder Membrane CZTS Printing membrane Embedding semiconductor powder Deposit-ing front contact Sealing module front side Post treatment of powder Crystalline CZTS Polished powder Polished powder Back sealing Back contact Addition of buffer layer CdS on CZTS Sealing module back side Printing back contact Removing foil and polishing powder Tallinn, Estonia Vienna, Austria Source: crystalsol D. Meissner
Some Conclusions • In order to keep the global CO2 level below 450 ppm (i.e. to have a chance to avoid global warming by more than 2 °C) at least 20 to 30 TW of power need to be provided without CO2 release (or avoided). • This huge amount of power can only be provided by direct use of solar and wind energy. This will mainly be electrical energy. • In order to build the necessary infrastructure today’s growth rates of these technologies (i.e. more than 20 % / a) need to be pursued the next 40 years. • Massive price reductions can lower the burden this will mean for all of us. Here TUT’s CZTS Monograin Technology may provide the final solution. Source: crystalsol D. Meissner