Download
1 / 6
80 likes | 262 Views
VOC Emissions what you get and what you calculate Reinhard Oppl Director VOC Testing Eurofins Product Testing A/S Galten / Denmark Folsom / California Shenzhen / China. Test chambers. Photo: Eurofins Product Testing A/S. Significance of test result.

E N D
VOC Emissions what you get and what you calculate Reinhard OpplDirector VOC Testing Eurofins Product Testing A/S Galten / Denmark Folsom / California Shenzhen / China
Test chambers Photo: Eurofins Product Testing A/S
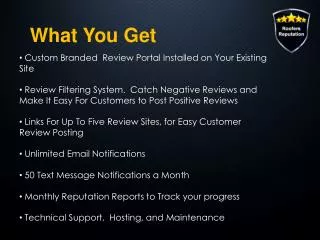
Significance of test result • What you get from chamber testing is:Test chamber air concentration at given time mg/m³,then we calculate from that: • Emission rate per hour, mg/h • Specific emission rate (emission factor), • per area mg/m²h • or per mass, per device, per unit • Contribution to air concentration, mg/m³ (source strength) in reference room or in real room after a specified time • Compare with limit values (always given as air concentration)
European Reference Room • Reference room - not a test room, but just a model • Needed for comparing test result with air concentration limit values • European Reference Room (CEN TC 351): • Floor area 12 m², Height 2.5 m, Volume 30 m³ • 1 window, 1 door • Then calculate loading factors (m²/m³) for walls etc., • ½ air change per hour • Area specific air flow rate (m³/m²h)= ach / loading factor • 23 °C, 50% relative humidity • As most products can be used in various exposure scenarios, this room is used as general reference for all situations • Testing shall simulate those rooms in small scale • Test chambers made of stainless steel or glass, 50 litres to several m³
Different Exposure Scenarios • US: Open-plan or private office, class room, residential • Different in surface, room height, furniture, equipment, ventilation • Why different exposure scenarios can make sense: • Some products are manufactured only to e.g. offices, schools, etc. and then are rated against specific conditions • Ambition is to predict air concentrations in such rooms • Why different exposure scenarios cannot make sense: • Almost all products are used in all scenarios • A product may pass one, but fail another scenario • (How) Will product marketing distinguish? • We need an unambiguous scale for rating products • Select one small room as worst-case scenario • Do not exaggerate precision in exposure scenarios; • e.g. round 1.89 m² to 2 m² (door in CA); 31.4 m² to 30 m² (walls in EU) • Emissions can vary over time ± 30-50%; testing uncertainty ± 30-50%
VOC long-term emissions – schedule • All programs evaluate in-use phase emissions • Evaluation mostly after 28 days in Europe, after 14 days in USA • Limits after 3 days cover renovation / refurbishing • Testing in ventilated test chambers; no correlation with VOC content Emissions Example of a decay curve Lifetime All emissions during lifetime = VOC content