1 / 1

Wells Drilled in the USA

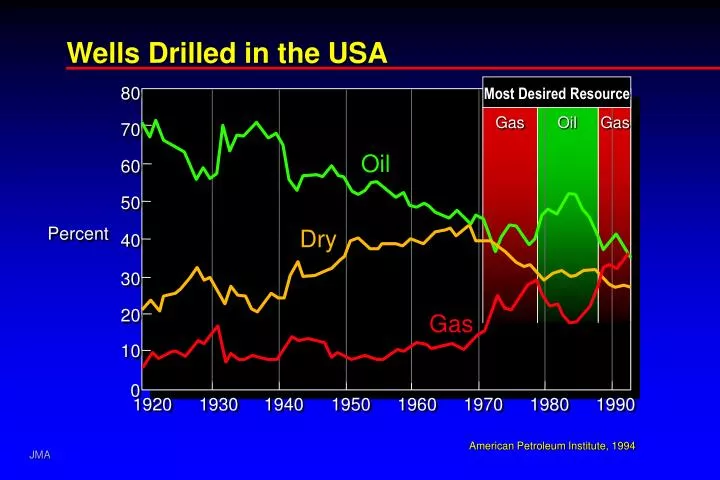
Wells Drilled in the USA. Most Desired Resource. 80. 80. Gas. Oil. Gas. 70. 70. Oil. Oil. 60. 60. 50. 50. Percent. Dry. Percent. Dry. 40. 40. 30. 30. 20. 20. Gas. Gas. 10. 10. 0. 0. 1920. 1930. 1940. 1950. 1960. 1970. 1980. 1990. 1920. 1930. 1940. 1950.

Download Presentation

Wells Drilled in the USA

An Image/Link below is provided (as is) to download presentation Download Policy: Content on the Website is provided to you AS IS for your information and personal use and may not be sold / licensed / shared on other websites without getting consent from its author. Content is provided to you AS IS for your information and personal use only. Download presentation by click this link. While downloading, if for some reason you are not able to download a presentation, the publisher may have deleted the file from their server. During download, if you can't get a presentation, the file might be deleted by the publisher.

E N D

Presentation Transcript


  1. Wells Drilled in the USA Most Desired Resource 80 80 Gas Oil Gas 70 70 Oil Oil 60 60 50 50 Percent Dry Percent Dry 40 40 30 30 20 20 Gas Gas 10 10 0 0 1920 1930 1940 1950 1960 1970 1980 1990 1920 1930 1940 1950 1960 1970 1980 1990 American Petroleum Institute, 1994

More Related