Download
1 / 9
90 likes | 186 Views
Binomial Probability. To be considered to be a binomial experiment Fixed number of trials denoted by n n trials are independent and performed under identical conditions Each trial has only two outcomes: success denoted by S and failure denoted by F

E N D
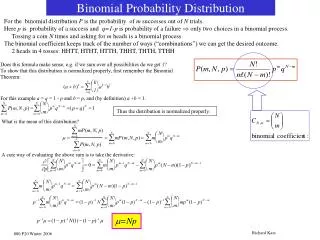
Binomial Probability To be considered to be a binomial experiment Fixed number of trials denoted by n n trials are independent and performed under identical conditions Each trial has only two outcomes: success denoted by S and failure denoted by F For each trial the probability of success is the same and denoted by p. The probability of failure is denote by q and p+q=1 (or q = 1 - p) The central problem is to determine the probability of r successes out of n trials. P(r) =
Understanding the Concept • If the doctor tells you that the success rate for a given operation is 50%. That means that any given time the operation is performed there is a 50% chance of success. • If the doctor performs 3 of these operations in a single day, the probability that all thee will be successful is 12.5%, it is also true that there is a 37.5% chance that 1 of the three will be successful. • Where do these percentages come from? • This is the discussion of the presentation
Finding the P( x successes) • There are several ways one can approach this problem • Calculating it by hand • Using a Binomial distribution table • Using technology
BASIC EXAMPLE • Given 5 trials, with an historical probability of success on A SINGLE TRIAL of 25% . Of the 5 trials • You can find the P(0 successes), P(1 success), P(2 successes) , P(3 successes), P(4 successes), or P(5 successes). • As an example, the following calculation will be for P(4 successes)
BY HAND P( 4 successes) • If n = 5 (number of trials) and p = 0.25, what is the probability of 4 successes let (x = 4)? • P(4) = ? • p + q = 1 so q = 1 – r = 1 – 0.25 = 0.75 Using the Formula on page 426 of text • P(x) = Cn,x times px times qn-x • P(4) = C5,4 0.254 0.755-4 • P(4) = 5 * 0.254 0.751 • P(4) = 5 * 0.0039 * 0.75 = 0.014625 ≈ 0.0146
By Table: P( 4 successes) By Using Binomial Probability table such as found at : http://www.uwsp.edu/math/hgonchig/Math_355/Tables/Binomial.pdf -P( 4 successes) • n=5, x=4, P(x) = 0.25 • P(4) = .0146 http://www.uwsp.edu/math/hgonchig/Math_355/Tables/Binomial.pdf
By Technology: P( 4 successes) Excel = BIOMDIST(4,5,0.25,false) Ans: .0.014648438 TI 83 – 84 2nd DISTR choice 0 ENTER binompdf ( 5,0.25,4) ENTER Ans: 0.14648375 IF YOU USE ONE OF THESE TWO METHOD, EITHER ATTACHED THE EXCEL WORKBOOK, OR IF USING THE TI 83 OR 84 STATE THE FUNCTION AND ITS PARAMETERS.
The Entire Probability Distribution • Given 5 trials, with an historical probability of success on A SINGLE TRIAL of 25% • P(of 0 success out of 5 trials) = .2373 • P(of 1 success out of 5 trials) = .3955 • P(of 2 successes out of 5 trials) = .2637 • P(of 3 successes out of 5 trials) = .0879 • P(of 4 successes out of 5 trials) = .0146 • P(of 5 successes out of 5 trials) = .0010
Summary • You should be able to calculate a binomial probability by any of the three methods. • Questions: post the slide number and your question to your individual forum.