Download
1 / 18
180 likes | 368 Views
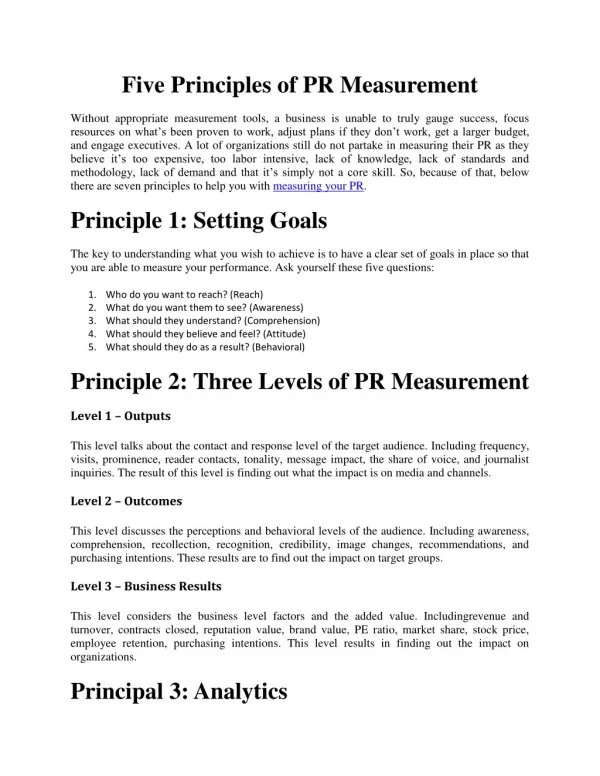
Valid Metrics for PR Measurement Putting The Principles Into Action Based on the Barcelona Declaration of Measurement Principles 7 June 2011. Table of Contents. Applying the Metrics to PR Functions: Slide 4: Valid Metrics Framework Template Slide 5: Brand/Product Marketing Application

E N D
Valid Metrics for PR MeasurementPutting The Principles Into Action Based on the Barcelona Declarationof Measurement Principles 7 June 2011
Table of Contents Applying the Metrics to PR Functions: Slide 4: Valid Metrics Framework Template Slide 5: Brand/Product Marketing Application Slide 6: Reputation Building Application Slide 7: Issues Advocacy and Support Slide 8: Employee Engagement Slide 9: Investor Relations Slide 10: Crisis and Issues Management Slide 11: Public Education/Not-for-Profit Slide 12: Social/Community Engagement Reference Information: Slide 14/15:How to Use the Matrix Slide 16: How We Got Here Slide 17: The Barcelona Principles Slide 18: Useful Resources
Valid Metrics Framework Template:(to see details on “How to Use the Matrix” go to slide 13) COMMUNICATIONS/MARKETING STAGES COMMUNICATIONS PHASES ORGANIZATION/BUSINESS RESULTS
Brand/ Product Marketing • Sales • Market share • Cost savings • Leads generated • Customer loyalty
Reputation Building • Sales • Market share • Share price • Talent retention and recruitment • Cost savings • Customer loyalty • Legislation/regulation passed or blocked
Issues Advocacy & Support • Active advocates • Letters of support (to government, etc.) • Registrations(to join support group) • Donations • Legislation/ regulation passed or blocked • Cost savings
Employee Engagement • Employee turnover • Employee productivity • Recruitment
Investor Relations • Share price • Earnings multiple • Earnings per share • Successful IPO/ acquisition/ merger
Crisis and Issues Management • Maintain share price/earnings multiple • Maintain market share/sales/ customers • Cost savings
Public Education/ • Not-for-Profit • Active advocates • Progress against target (e.g. reduction in teen pregnancies) • Cost savings
Social/Community Engagement • Active advocates • Brand engagement • Leads/sales • Revenue • Market share • Cost savings NOTE: Within social media, several of these metrics could straddle two rows as an Intermediary Effect and/or Target Audience Effect, depending on who’s engaged in the conversation. For simplicity, we have listed those metrics under Intermediary Effect to reflect the general conversation as you would not know if all participants are in your target audience. If the commenters are known to be in your Target Audience, you could reflect those metrics under Target Audience Effect.
Valid Metrics Framework Reference Information
How to Use the Matrix The matrix was constructed to reflect this simplified process: • Public Relations Activity – metrics reflecting the process of producing or disseminating the desired messages • Intermediary Effect – metrics reflecting the third party dissemination of the messages to the target audience • Target Audience Effect – metrics showing that the target audience has received the communications and any resulting action-driven outcomes The matrix was then applied to a series of grids, acknowledging the fact that the desired business result for different types of campaigns varies according to the objective. Each grid pertains to a different function of Public Relations/Public Affairs. They include Brand and Product Marketing, Reputation Building, Issues Advocacy and Support, Employee Engagement, Investor Relations, Crisis and Issues Management, Public Education/Not-for-profit and Social/Community Engagement. While each grid outlines specific metrics for its campaign objectives, there is naturally some overlap. Most importantly however, the desired business result for each type of campaign is captured in the final box on the grid. The continuum concept was also applied to how communications are received by the target audience. The grid’s horizontal axis is based on what is commonly known as the Communications or Marketing Funnel. The stages of this funnel are awareness, understanding, interest/consideration, support/preference and action. Metrics have been grouped under these stages to help PR practitioners demonstrate how communications are absorbed, in nomenclature that marketers understand. UNDERSTANDING THE MATRIX The Valid Metrics guidelines take the form of a matrix, with the underlying logic of the matrix applicable to a number of different types of campaigns. Within the matrix, three phases have been defined to reflect a (very) simplified breakdown of how Public Relations works. In essence, PR can be boiled down to three phases: • The messages or story is created and told • The story is disseminated via a third party/intermediary, such as journalists, influencers or bloggers • The story is consumed by the target audience, which if successful leads to behavior change and the desired business result
How to Use the Matrix (continued) • Applying the Matrix • There are five simple steps to applying the matrix: Other Points To Note: • Once selected, the metrics should be tracked over time to identify trends. • Consider plotting outcome metrics from the “Target Audience Effect” row against metrics from the “Intermediary Effect” row to show correlations. • Consider applying cost per thousand (CPM) calculations against the “Intermediary Effect” and “Target Audience Effect” metrics. CPM is calculated by dividing the total cost by the relevant number to get cost per message, cost per article, etc. • Approaches using gross rating points (GRP), which measure reach against percent of total population, and target rating points (TRP), which measure reach against percent of targeted population, can also be applied to “Intermediary Effect” metrics if relevant population numbers are available. • The grids are not exhaustive and there may be other metrics that are appropriate to the campaign being measured. 1. Choose the grid that is relevant to the campaign being measured. 2. In the row titled “Public Relations Activities”, determine the activities being conducted for the campaign and identify metrics for each. For example, for “Media Engagement”, potential metrics are: number of journalists briefed, number of press releases distributed and number of press kits created. 3. In the row titled “Intermediary Effect”, review the suggested metrics and determine which are appropriate to collect, given the resources available. Keep in mind, however, that these metrics do represent those most commonly used in media and blogger analysis, and it is recommended that as many as possible be included in the measurement program. 4. In the row titled “Target Audience Effect”, review the suggested metrics and again determine which are appropriate given the resources available. Many of these metrics require a survey to be conducted, but this does not need to be a large drain on resources. Online polls are a cost-effective way to reach many audiences. Attitudes can also be gathered by reviewing the opinions expressed by members of the target audience through online communities. Web analytics (of the client’s site) can also be used to assess consideration and preference among the target audience. Informal surveys can be conducted through community sites. 5. Finally, in the “Action” box, determine which of the business or organizational outcomes are relevant to the client and are feasible to track. Ideally at least one business/organizational outcome should be identified as the ultimate objective of the campaign.
Background: How We Got Here The Valid Metrics Guidelines The Valid Metrics guidelines were developed by an AMEC taskforce following the launch of the Barcelona Principles. The initial draft of the guidelines were previewed at the IPR Measurement Summit in Portsmouth USA, in October 2010 and made available for public comment. Input was received from a number of international industry bodies, including the CIPR, PRCA, PRSA and IPR. The final guidelines were then presented at AMEC’s London conference in November 2010. These guidelines should serve as a framework for indentifying possible metrics for individual PR programs. They are not intended to be the definitive rules of measurement and therefore do not include every possible metric. As all PR programs need customized measurement, the user should feel free to consider other metrics which demonstrate progress against objectives and combine metrics as needed to suit the details of the communications program under consideration. • Replacing AVEs • If you were using AVEs as the sole metric for evaluating PR success, there is no single replacement metric. Public Relations is a broad discipline that requires multiple metrics tied to well-defined objectives. These guidelines provide many alternatives to AVEs and are intended to help practitioners identify a palette of Valid Metrics that will deliver meaningful measurement to reflect the full contribution of Public Relations. • If you were using AVEs to provide comparative media costs for PR in relation to other marketing disciplines, there are several metrics that can be appropriately used for evaluating earned media results against paid media results. These include earned impressions, which measures potential reach based on media impressions data; earned cost per thousand (CPM) impressions, which measures the efficiency of earning media coverage and enables comparison to the efficiency of other marketing vehicles; gross rating points (GRP); and target rating points (TRP). • If you were using AVEs to provide a dollar/euro/yen or other financial denomination for PR results, there are several metrics that can be used appropriately to measure public relations in financial terms (where demonstrable). These include total value of sales/sales leads/revenue generated by PR activities; PR activities’ contribution to sales/sales leads/revenue (often calculated via marketing mix analysis); cost savings due to PR activities (e.g. reduced customer complaints, etc.); increased target market size due to expanded mindshare; and increased or decreased market capitalization. The PhilosophyBehind the Guidelines There were two primary challenges facing the taskforce as it developed the structure for the guidelines. Firstly, the industry has become used to the beguiling singularity of AVEs, even though in reality there is no one perfect metric to measure the entire breadth of PR. Public Relations addresses many different publics and has many different forms of impact – from selling a product, to building a company’s standing in a community, to mitigating a crisis, to improving employee engagement. Recognition of the many achievements of PR requires more than one metric. Secondly, to truly demonstrate the value of PR, metrics need to be linked to the business objective of the program. The guidelines are therefore based on the philosophy that PR measurement has to move beyond measuring outputs to measuring outcomes. As a result, the taskforce came to the conclusion that PR measurement needs to be shown as a continuum of metrics – starting with outputs, but including outcomes and ultimately business results – with the desired business results corresponding to the campaign objective. • CONCLUSION • The Valid Metrics guidelines are not intended to be a rulebook. Practitioners are free to select the metrics that fit their budget and, most importantly, their objectives. These grids are not intended to be all-encompassing. They simply represent a starting point on the journey to objectives-based measurement with a greater business focus and which will hopefully move the industry beyond AVEs.
The Barcelona Principles The 7 Barcelona Principles are: 1. Importance of goal setting and measurement 2. Measuring the effect on outcomes is preferred to measuring outputs 3. The effect on business results can and should be measured where possible 4. Media measurement requires quantity and quality 5. AVEs are not the value of public relations 6. Social media can and should be measured 7. Transparency and replicability are paramount to sound measurement.
Useful Resources Dictionary of Public Relations Measurement and Research by Don Stacks, available for free through the Institute for Public Relations at the link: http://www.instituteforpr.org/research_single/dictionary_public_relations/ The Barcelona Principles are available through this link: http://www.amecorg.com/images/public/barcelonaprinciplesforprmeasurementslidesfinal_22july2010.ppt