Download
1 / 19
190 likes | 321 Views
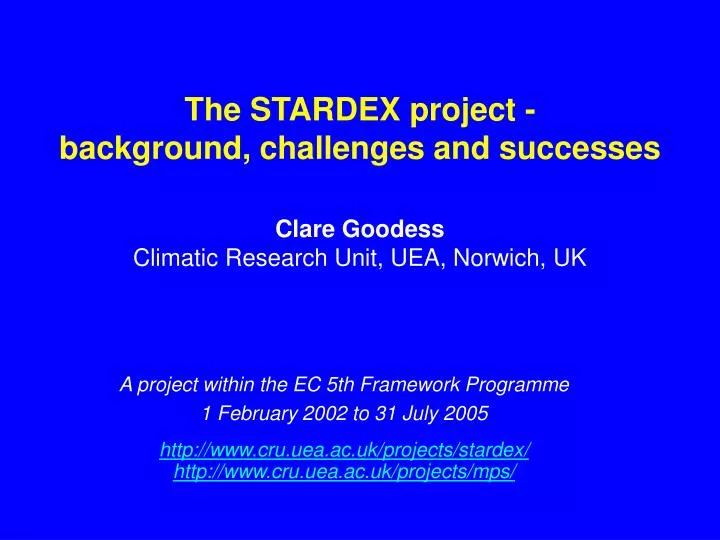
The STARDEX project - background, challenges and successes. A project within the EC 5th Framework Programme 1 February 2002 to 31 July 2005 http://www.cru.uea.ac.uk/projects/stardex/ http://www.cru.uea.ac.uk/projects/mps/. Clare Goodess Climatic Research Unit, UEA, Norwich, UK.

E N D
The STARDEX project - background, challenges and successes A project within the EC 5th Framework Programme 1 February 2002 to 31 July 2005 http://www.cru.uea.ac.uk/projects/stardex/ http://www.cru.uea.ac.uk/projects/mps/ Clare Goodess Climatic Research Unit, UEA, Norwich, UK
The STARDEX consortium http://www.cru.uea.ac.uk/projects/stardex/
STARDEX general objectives • To rigorously & systematically inter-compare & evaluate statistical and dynamical downscaling methods for the reconstruction of observed extremes & the construction of scenarios of extremes for selected European regions & Europe as a whole • To identify the more robust downscaling techniques & to apply them to provide reliable & plausible future scenarios of temperature & precipitation-based extremes http://www.cru.uea.ac.uk/projects/stardex/
Consistent approach: e.g., indices of extremes http://www.cru.uea.ac.uk/projects/stardex/
STARDEX Diagnostic extremes indices software • Fortran subroutine: • 19 temperature indices • 35 precipitation indices • least squares linear regression to fit linear trends & Kendall-Tau significance test • Program that uses subroutine to process standard format station data • User information document • All available from public web site http://www.cru.uea.ac.uk/projects/stardex/
STARDEX core indices • 90th percentile of rainday amounts (mm/day) • greatest 5-day total rainfall • simple daily intensity (rain per rainday) • max no. consecutive dry days • % of total rainfall from events > long-term P90 • no. events > long-term 90th percentile of raindays • Tmax 90th percentile • Tmin 10th percentile • number of frost days Tmin < 0 degC • heat wave duration http://www.cru.uea.ac.uk/projects/stardex/
1958-2000 trend in frost days Days per year Blue is increasing
1958-2000 trend in summer rain events > long-term 90th percentile Scale is days/year Blue is increasing
Region Winter Spring Summer Autumn England ++ -- Germany ++ + -- + N. Italy - - + + Greece - - Switzerland ++ + + ++ French Alps variable variable variable + Local scale trends in extreme heavy precipitation indices
Investigation of causes, focusing on potential predictor variables e.g., SLP, 500 hPa GP, RH, SST, NAO/blocking/ cyclone indices, regional circulation indices http://www.cru.uea.ac.uk/projects/stardex/
Winter R90N relationships with MSLP, Malcolm Haylock http://www.cru.uea.ac.uk/projects/stardex/
Winter R90N relationships with MSLP, Malcolm Haylock R90N Canonical Pattern 1. Variance = 11.3%. MSLP Canonical Pattern 1. Variance = 44.4%. http://www.cru.uea.ac.uk/projects/stardex/
Analysis of GCM/RCM output & their ability to simulate extremes and predictor variables (and their relationships) http://www.cru.uea.ac.uk/projects/stardex/
Mean 90% quantile HadRM3 HIRHAM Christoph Frei, ETH
Inter-comparison of improved downscaling methods with emphasis on extremes http://www.cru.uea.ac.uk/projects/stardex/
Radial Basis Function: Colin Harpham/Rob Wilby NW England, 90th percentile for DJF Validation period: 1979-1993 Red: observations Blue: predictors selected using stepwise regression, r=0.34 Black: predictors selected using compositing, r=0.24 http://www.cru.uea.ac.uk/projects/stardex/
At the end of the project (July 2005) we will have: • Recommendations on the most robust downscaling methods for scenarios of extremes • Downscaled scenarios of extremes for the end of the 21st century • Summary of changes in extremes and comparison with past changes • Assessment of uncertainties associated with the scenarios http://www.cru.uea.ac.uk/projects/stardex/
Dissemination & communication • internal web site (with MICE and PRUDENCE) • public web site • scientific reports and papers • scientific conferences • information sheets, e.g., 2002 floods, 2003 heat wave • powerpoint presentations • external experts • within-country contacts
http://www.cru.uea.ac.uk/projects/stardex/ http://www.cru.uea.ac.uk/projects/mps/ c.goodess@uea.ac.uk