Download

1 / 86
930 likes | 1.28k Views
Business Review. This template is used to assist in the development of the company’s yearly business review. Content Overview. Mission Statement and Support Objectives Business Performance - Financial Review Summary Performance by Major Category. Examples - Sales by Category

E N D
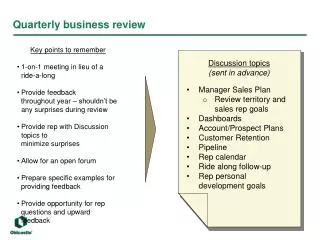
Business Review This template is used to assist in the development of the company’s yearly business review.
Content Overview Mission Statement and Support Objectives Business Performance - Financial Review Summary Performance by Major Category • Examples - • Sales by Category • Historical Performance • Performance Trend • Category Profile • Profitability Analysis • Price Ladder • Seasonality • Category • Channel • Distribution • Mix by Channel • Brand Mix • Product Ranking
Content Overview Customer Overviews Product Category Overviews Competitor Overviews Consumer Learnings Key Issues and Market Trends SWOT Analysis Consumer Promotion Review Enablement? Cross-BU Integration?
Mission Mission Statement: State your company’s mission statement here. Support: Add any additional supporting information about your company. Example: What is your company doing differently than the competitors?
Objectives • What are the company’s objectives and how will be objectives be accomplished? • Examples: • Improve sales with more direct marketing plans. • Generate $25 million in sales between January and June • Increase Market Share • Build a Better Product than the Competition • Maximize Customer Satisfaction • Help Other Corporate Businesses • Reduce Number of Employees • Cut Expenses • Maximize Revenue • Maximize Annual Profit • Maximize Return on Investment (ROI) • Maximize Return on Equity (ROE) • Maximize Return on Assets (ROA) • Maximize Return on Sales (ROS) • Maximize Shareholder Value & Discounted Cash Flow • Expand into New Markets • Minimize Risks • Provide for the Employees • Help Community
Business Performance - Sales by Category Insert a graph of the major categories of your company’s product line or service. Describe what is the major categories that are dominating.
Business Performance - Historical Performance by Category Explain what categories are growing, declining or staying constant.
Business Performance -Performance by Major Category Insert percentage bar graph to illustrate growing or declining trend within the family of products or services.
Business Performance - Category Profile Don’t know what to do here…. Bubble Size reflects size of business in sales dollars
Business Performance - Profitability Analysis Describe what categories are dominating in the profitability analysis.
Business Performance - Price Ladder and Profitability Analysis Benchmark Price Ladder
Business Performance - Seasonality Insert seasonality graph to illustrate the seasonal sales changes in category.
Business Performance - Seasonality by Channel Insert graph to illustrate seasonal performance by Distribution Channel. Example: Mass Market, Superstore Retail, Online, Boutiques, Commercial, International, Distributors.
Business Performance -Distribution Insert any observation you might see in regards to the company’s distribution. Example: What are the major channels that might be areas to concentrate more focus in.
Business Performance -Distribution • Observations: • What observations are present in each area of distribution? • Example: • Mass Market is more willing to purchase lower price items. • Commercial Market purchases all spread out through all price ranges.
Business Performance -Brand Mix Observations: This area can be used to present the brand mix of your company’s product or service.
Business Performance -Product Product Ranking by Sales $ YTD Observations: This area observes the top ranking products/services for the company.
Business Performance -Customer Overviewby Distribution • Observation: • Indicate the reasons for sales growth or decline with the customers. • Example: • Customers closed several stores. • Customer downsized areas of their company.
Business Performance -Direct Print Fact Sheet What to do here? Product Ranking - June YTD 2002 Observations:DP continues a broad decline, across customers and products, with the exception of bulk packs
Business Performance -Direct Print What to do here? • Direct Print Sales Trend • Sales decline resulted from loss of superstore distribution. • 2002 SS Returns: • OfficeMax - SKU 11576 and 11577 (Ink Jet). • Staples - SKU 11576 • Only SS distribution remaining is at Office Depot • (11536 & 11537 5T LSR and IJ.)
Business Performance -Direct Print What to do here? • Direct Print Commercial Sales • Commercial channel contributes to 95% of the DP business • and is growing (YTD +2.2% versus YAG). • Growth is fueled by the performance of the 24 set laser • (+13% vs. YAG). Loyal users are trading up to 24-set packs.
Business Performance -Direct Print What to do here? • Direct Print Sales by Printer Type • Laser is still bulk of the business. DP ink jet dividers experienced • higher total sales decline due to loss of distribution at superstores. • Color is growing in the commercial channel (small $ base) *Direct Print Collating = $133,831 (6% of total)
Business Performance -Direct Print • Direct Print Margin Ladder • Overall margin will continue to improve with elimination of • DP single sets at the end of 2004. Single set only yields a 47% GM. 78% GM Gross Margin $ 85% 80% 80% 81% 77% 82% 79% Source: Brio Data
Business Performance -Direct Print • Direct Print Unpunched Sales • After strong growth in 2000, DP unpunched has been down significantly in 2002 • Possibly cannibalized by IM or other alternatives
Business Performance - Index Maker Fact Sheet Index Maker Product Ranking - June YTD 2002
Business Performance - Index Maker Index Maker Sales by Major Family - July YTD 2002 • Observations: • Index Maker continues to grow in all Major Families, except Copier, which is down 16% • While the highest growth rates are coming from 2nd Tier and Transluscents, their size and overall contribution remains small • Index Maker sales and volume growth remain dominated by Avery Branded paper IM with white and color tabs
Business Performance - Index Maker Index Maker Punched/Unpunched Analysis (Laser Only) WOW! • Observations: • It is surprising to note that punched sales have declined vs prior July YTD • With unpunched only available in white laser Index Maker, there is opportunity to expand our offering of unpunched in other areas (i.e. Color IM) • We will need to continue monitoring punched sales to determine if the minor family is mature/flat
Business Performance -Ready Index Fact Sheet Ready Index Product Ranking - June YTD 2002 Observation: Ready Index, in contrast to IM, sales are dominated by single set packs
Business Performance - Ready Index Superstores decline in 2001 is slowing down this year, which could be a result of improving inventory control. Commercial is flat after last year’s customer consolidation and inventory reductions. Mass was up in 2001 with the RI/IM Presentation Center at Wal-Mart, but we are currently encountering returns for that project. Mass sales are declining this year as the price competition continues across manufacturers. Channel & Customer Sales Detail
Business Performance - Ready Index - SKUs with Declining Sales Our best selling SKUs are also our “no growth” products! Most of these “no growth” items are single sets of RI Cont Std. Landscape Ready Index single and 6-packs topped the list. These items should be discontinued for 2004. Easy Edit is doing poorly in single set packs. SKU rationalization decisions to discontinue Executive Hidden Tab and Contemporary Hidden Tab are validated by the rankings of these products.
Business Performance - Ready Index - SKUs with Best Growt (Cont’d) While Easy Edit single sets are among the under performing SKUs, 6-set packs of Easy Edit are among the highest growth products. 6-sets packs of RI Contemporary Standard are performing well. Private label TOC products for Corporate Express and Office Depot are performing well.
Business Performance -Ready Index Single set packs are losing ground to 6-set packs. Three-set packs were done for OD Exec. RI, which has been discontinued as of mid-2001 24-set packs are flat since 2000 (24 sets are uncoallated)
Business Performance -Write - On Fact Sheet Write-On/Plain Tab Product Ranking - June YTD 2002
Business Performance -Insertables Fact Sheet Insertable Product Ranking - June YTD 2002
Business Performance -Legal Dividers Fact Sheet Legal Product Ranking - June YTD 2002 Observation: Legal continues to be an area of operational challenges with low volumes for the majority of items while at the same time demonstrating marketing potential for expansion
1B bound documents are created each year. The desktop binding supplies market is estimated at $150MM annually (U.S. manufacturer sales). 60% of sales are through copy centers & printers. 40% of sales are through the traditional office supply channels for desktop binding applications. Growth in the category is flat at ~ 2-3% per year. GBC dominates the category in both the Superstore and Commercial Channels. 85% of documents are bound with plastic comb. 5% of bound documents created at the desktop use dividers. Attachment rate with binders is 50%. Business Performance -Bound Documents Source: Desktop Document Binding Market Study, Nauset, June 2001
Business Performance -Bound Documents Historical Sales Summary • Facts: • Stong overall growth trend. 2001 decline was consistent with Index Maker punched sales decline (-3.9%). • Index Maker unpunched represents 87% of our Bound Document Supplies business. • Without Covers, 2002 YTD unpunched Divider sales +17%. • Key Issue: Highly dependent on Index Maker unpunched sales. • Implication: Need to build Cover business to strengthen position in the category.
Business Performance -Tabs & Flags Background: Tabs & Flags is approximately a $150MM category (factory sales). Market share is dominated by 3M Post-it Flags with over $100MM in annual sales. Redi-Tag is #2 in the category with approximately $10MM in annual sales. They provide the low cost alternative to 3M. Avery’s current range of Tabbing products generated sales of $6.9MM in ‘01 (-14% vs. ‘00). “Tabs” are for frequent reference vs. “Flags” which are for temporary page marking. Tabbing category identified as an adjacent category for growth.
Business Performance -Tabs & Flags Key Observations: Avery is loosing share to alternative products and competition. Recent increase in competition from 3M with their Post-it Durable Index Tabs (2 SKU’s). Must differentiate our new products from 3M’s products. Significantly increased activity from Redi-Tab with new catalog listings and Superstore POG space. Overall positive response from customers to our initiatives to reinvigorate our Tabbing line. Small overall share position and reasonable profitability makes this an attractive adjacent category.
Business Performance -Tabs & Flags Sales Summary (July YTD 2002) • Facts: • Shield Tabs 51% of sales, Gray Cloth Tabs 26% of sales. • Printable Tabs 1st new product since ‘94. Excluding Printable Tabs, sales -8% • Key Issue: Core Shield Tabs undifferentiated from competition. Overall declining business. Losing share to alternative products and competition. • Implication: Business will continue to decline without further action.
Business Performance -Tabs & Flags Profitability Analysis Profitability Analysis (July 2002 YTD) • Facts: • Solid profitability for category. • Profitability has declined. 5% decline in 2001. • Low profitability lines should be addressed (Strip Tabs & WS Inserts). • Key Issue: Declining sales volume is reducing profitability due to fixed overhead costs associated with business. • Implication: Need to grow core line sales or reduce costs to increase or maintain profitability (share gain, merchandising).
Competitive Market Share Observation: What reasons can be said as to why one channel is dominating over another. Examples: What channels are continuing to be the weakest Distribution Channel 1 continues to be the strongest because of lower prices Distribution Channel 2 grew with extensive marketing campaign .
Retail Price Ladder Observation: Insert graph to illustrate the price differences between your company’s products/services vs. competitors. How does your product/service compare to your competitors? Price Ladder for Company and Competitor product/service
Competitive Distribution by Major Retailer Observation: What does your company’s distribution by the major retails compare to your competitors?
General Competitive Overview This section provides a brief description of the top competitors in the Index Dividers category. What sources was your data compiled from? Example: Hoovers - website that delivers comprehensive company, industry, and market intelligence that drives business growth Company websites Interviews internal staff The key players in your product catagory: 1) Competitor 1 2) Competitor 2 3) Competitor 3 4) Competitor 4
Competitor Profiles Background and history: Financials: Products: Current Strategy: Market Share: Detail all areas for each competitor.