Download
1 / 14
150 likes | 162 Views
Module 2.3 Estimating emission factors for forest cover change: Deforestation. Module developers: Sandra Brown, Winrock International Lara Murray, Winrock International Country example: Guyana All data courtesy of Winrock International and Guyana Forestry Commission. V1, May 2015.

E N D
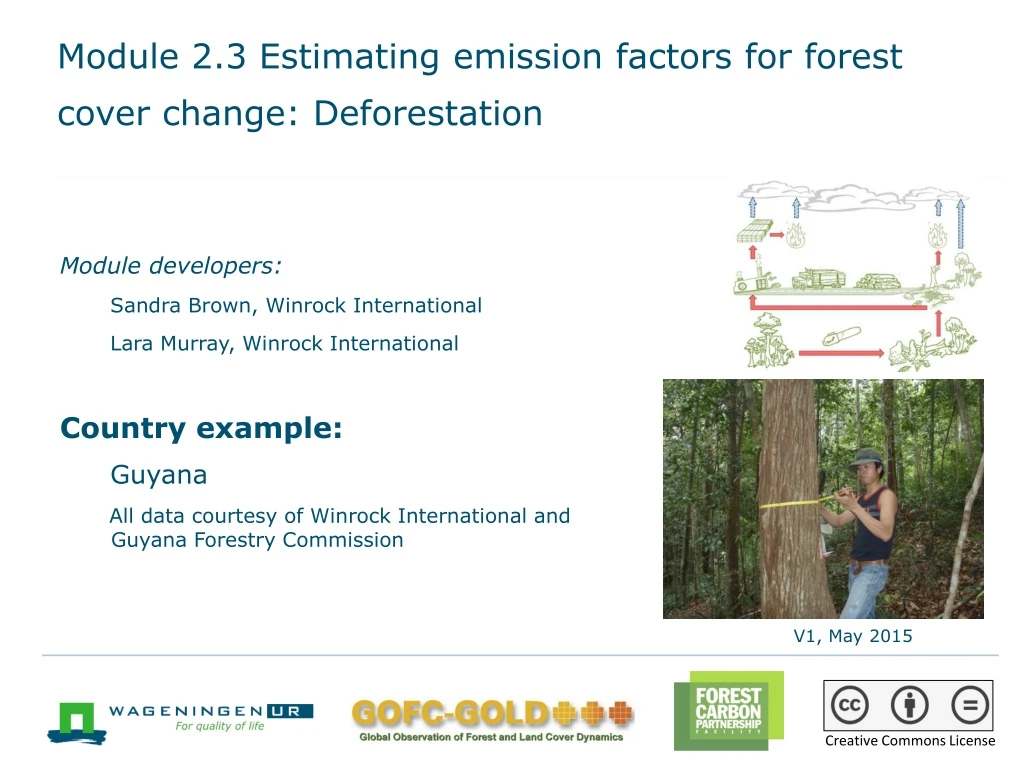
Module 2.3 Estimating emission factors for forest cover change: Deforestation Module developers: Sandra Brown, Winrock International Lara Murray, Winrock International Country example: Guyana All data courtesy of Winrock International and Guyana Forestry Commission V1, May 2015 Creative Commons License
Outline of country example • REDD+ development in Guyana • Approach to sampling and stratification in Guyana • Stratification by threat of deforestation • Collecting primary data field data for planning • QA/QC measures • Carbon stock data and emission factors
REDD+ development in Guyana • Guyana is an example of a high forest cover, low deforestation rate (HFLD) country. • Since 2009, the Government of Norway has provided performance-based finance to implement a low-carbon development strategy (LCDS). • Guyana is a World Bank FCPF pilot country.
Drivers of deforestation and degradation in Guyana Forest cover change 1990-2010 The national scope • Deforestation: • Mining—medium and large scale • Infrastructure—roads, settlements • Agriculture—permanent • Fire from human actions • Degradation: • Forestry—for timber production • Mining—small scale • Shifting cultivation • Fire from human actions Total forest loss by period 2009-2010 2005-2009 2000-2005 1990-2000 Non Forest 2009
Stratification by threat using spatially explicit land-use change modeling
Stratifying forest lands in Guyana Heuristic factors Factors in 2000: • Roads (main and secondary) • Rivers • Settlements • Townships (markets) • Eligible areas (mining and forestry concessions, protected areas, state forest,state land, Amerindian areas) • Forest species composition • Fire incidents per forest species type • Elevation • Slope • Soil dominant class Roads Elevation Eligible land 2000 Roads Eligible land 2000 Townships/ markets Roads Empirical factors Elevation Roads Elevation Eligible land 2000 Townships/ markets
Stratification by threat of deforestation • GEOMOD analysis was used to identify spatial patterns of change in relation to drivers and other factors and generate a “threat map.” • Stratifying by “threat” allows for estimating carbon stocks of forests where changes have occurred and likely to occur in future. • This reduces sampling effort while maintaining low uncertainty in estimates of emission factors.
Collection of primary field data for planning 24 Single Plots—mean +/- 95% CI 29 Cluster Plots—mean +/-95% CI Mean t C/ha±95%CI No difference in C stocks of main forest types No further stratification by forest type Forest type
Decisions on sampling design for developing emission factors • Use stratified two-stage list sampling design with clustered plots • Divide sampling into three phases: phase 1 = high threat area, phase 2 = medium threat area, phase 3 = low threat area • No need to stratify by forest type in high threat zone • Need to stratify by accessibility for cost-effective sampling—divided into more accessible (area of buffer of 5 km width on each side of all roads) and less accessible (area outside buffer) • Preliminary data used to estimate number of cluster plots to be installed in the more accessible and less accessible strata • Include the following C pools: aboveground biomass of trees to 5 cm minimum DBH, standing and lying dead wood, litter, and soil to 30 cm depth
Sampling design for obtaining estimates of C stocks for developing EFs • The country is divided systematically into 10 km x 10 km blocks (primary sampling units, PSUs) (left). • The forest is divided into accessibility strata and phases (middle). • PSUs within each stratum are selected using a stratified two-stage list sampling design for carbon measurement (right). • Secondary sampling units (SSUs) designed as L-shaped clusters are established within each PSU, and carbon measurements are obtained.
QA/QC: SOPs and tools to automate calculations for all field data Worksheet links to data collected using standard operating principles (SOPs) 11
Development of emission factors (EFs) for deforestation EF developed = from field measurements of 40 cluster plots (overall precision 95%, CI = 12% of mean) Carbon stocks in all pools C stock change in soil These values were used to develop EFs for deforestation. Post deforestation stocks for biomass pools = 0.
Development of emission factors for deforestation EFs including all pools and changes in soil stocks by stratum and driver for high threat area
Recommended modules as follow-up • Module 2.4 to learn about involving communities / local experts in monitoring changes in forest area and carbon stocks. • Module 2.5 to estimate carbon emissions from deforestation and forest degradation • Modules 3.1 to 3.3 to proceed REDD+ assessment and reporting.