Download
1 / 22
220 likes | 225 Views
Characteristics of the TMPA and Input Data Sets G.J. Huffman 1,2 , R.F. Adler 1 , D.B. Wolff 1,2 , D.T. Bolvin 1,2 , E.J. Nelkin 1,2 1: NASA/GSFC Laboratory for Atmospheres 2: Science Systems and Applications, Inc. Outline Design The KWAJ Radar Inter-satellite Calibration

E N D
Characteristics of the TMPA and Input Data Sets G.J. Huffman1,2, R.F. Adler1, D.B. Wolff1,2, D.T. Bolvin1,2, E.J. Nelkin1,2 1: NASA/GSFC Laboratory for Atmospheres 2: Science Systems and Applications, Inc. Outline Design The KWAJ Radar Inter-satellite Calibration 3B43 Comparison with GPCP and TCI KWAJ Results Future Summary
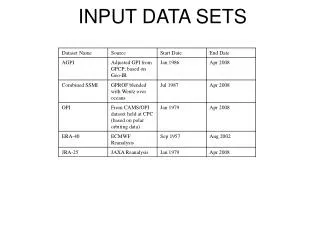
1998 2000 2002 2006 2004 TMI,PR SSM/I F13 SSM/I F14 SSM/I F15 SSMIS F16 SSMIS F17 AMSR-E AMSU-B N15 AMSU-B N16 AMSU-B N17 MHS N18 MHS MetOp GPCP IR Histograms CPC Merged IR 1. DESIGN – Goals Use “all available” data Traceable calibration Minimal statistical changes in the face of changes in the sensor inventory Real Time (RT) consistent with research product (Version 6, or V.6) “Fine” scale – 3 hr, 0.25°
1. DESIGN – Implementation Intercalibrate microwave sensors with “TRMM Best” - TRMM Combined Instrument best vs. atolls over ocean in V.6 - TMI only choice in RT - apply histogram matching (no constraint on pattern) Calibrate IR with combined microwave - “colder clouds rain more” histogram matching - no constraint on pattern - not a great concept for instantaneous data - use month-long match-ups for stability - fall-back scheme for cold/frozen land and sea ice where microwave fails Combination implemented as IR values filling gaps in microwave coverage - Many other schemes skew the statistics - Data boundaries remain [V.6 only] Rescale combination fields to the monthly Satellite-Gauge combination - Reproduce large-area bias of wind-corrected gauge analysis - Minimal dependence on gauge analysis where gauges are absent
2. THE KWAJ RADAR TRMM has provided upgrades to the 10-cm weather radar on the U.S. Army base at Kwajalein Island, Republic of the Marshall Islands, and collected data since 1999 for validation - essentially the only long record of research-grade radar over tropical ocean - multiple attempts to solve problems in the data record The Relative Calibration Adjustment appears solid - accounts for both gain and pointing angle changes - based on daily and hourly 95th percentile signal from fixed list of ground clutter targets Radar precipitation estimates are gauge- calibrated - only use data within 100 km to minimize range effects - gauges not wind-corrected 10°N 9°N 8°N 167°E 168°E 169°E
3. INTER-SATELLITE CALIBRATION Satellites require intercalibration to avoid bias jumps as the inventory of input data changes - done in TMPA by histogram matching - AMSR and SSM/I are close to TMI, so calibrated histogram nearly identical AMSR SSMI
3. INTER-SATELLITE CALIBRATION (cont.) (NESDIS) AMSU is less well- behaved - spikes in original (red) due to fixed “indeterminate” values - low sensitivity to light rain Calibration (blue) performs as best it can - higher spike moves up - lower spike moves down - no values just below peaks until CDF “catches up” Remaining issue: fractional coverage by rain - monthly fraction of boxes with rain, ocean 35°N-S TMI 86% AMSR 84% SSMI 81% AMSU 75% - shortfall in AMSU shows up as gap in light rain - improved over previous version AMSU
4. 3B43 COMPARISON TO GPCP AND TCI V.6 3B43 differs from GPCP TCI calibrator for tropical ocean has less interannual variability than GPCP The average 3B43 tracks with the TCI, but: A negative bias develops in 2000 due to the start of NESDIS AMSU-B estimates - the issue is light precip detection over ocean - Aug. 2003 algorithm has a bigger detection bias - June 2007 algorithm has smaller detection bias - AMSU-B reprocessed before June 2007, but 3B43 hasn’t been
5. KWAJ RESULTS – 0.25° 3-hourly Fine-scale test over ocean with area-average validation - each year of 2000-2006, except 2004 - better than typical daily results over land – no high TMPA outliers at low validation - already hints of 1:1 con- vergence - note inter- annual variation
5. KWAJ RESULTS – 100 km, 3 hour 2002 repeated No averaging for satellite; average of 15-min data from radar
5. KWAJ RESULTS – 100 km, 3 hour Average over 100-km radius (to avoid radar range effects) - computed from 3-hr accumulations - RT calibrated to V.6 with trailing month calibration Correlation 3h 0.84 Daily 0.89 5-Daily 0.90 1-Daily 0.91 Monthly 0.92 Seasonal 0.94 Bias seems relatively constant RMS decreases steadily - distribution pulls in toward the 1:1
5. KWAJ RESULTS – 100 km, 1 day Average over 100-km radius (to avoid radar range effects) - computed from 3-hr accumulations - RT calibrated to V.6 with trailing month calibration Correlation 3h 0.84 Daily 0.89 5-Daily 0.90 10-Daily 0.91 Monthly 0.92 Seasonal 0.94 Bias seems relatively constant RMS decreases steadily - distribution pulls in toward the 1:1
5. KWAJ RESULTS – 100 km, 5 day Average over 100-km radius (to avoid radar range effects) - computed from 3-hr accumulations - RT calibrated to V.6 with trailing month calibration Correlation 3h 0.84 Daily 0.89 5-Daily 0.90 10-Daily 0.91 Monthly 0.92 Seasonal 0.94 Bias seems relatively constant RMS decreases steadily - distribution pulls in toward the 1:1
5. KWAJ RESULTS – 100 km, 10 day Average over 100-km radius (to avoid radar range effects) - computed from 3-hr accumulations - RT calibrated to V.6 with trailing month calibration Correlation 3h 0.84 Daily 0.89 5-Daily 0.90 10-Daily 0.91 Monthly 0.92 Seasonal 0.94 Bias seems relatively constant RMS decreases steadily - distribution pulls in toward the 1:1
5. KWAJ RESULTS – 100 km, monthly Average over 100-km radius (to avoid radar range effects) - computed from 3-hr accumulations - RT calibrated to V.6 with trailing month calibration Correlation 3h 0.84 Daily 0.89 5-Daily 0.90 1-Daily 0.91 Monthly 0.92 Seasonal 0.94 Bias seems relatively constant RMS decreases steadily - distribution pulls in toward the 1:1
5. KWAJ RESULTS – 100 km, seasonal Average over 100-km radius (to avoid radar range effects) - computed from 3-hr accumulations - RT calibrated to V.6 with trailing month calibration Correlation 3h 0.84 Daily 0.89 5-Daily 0.90 1-Daily 0.91 Monthly 0.92 Seasonal 0.94 Bias seems relatively constant RMS decreases steadily - distribution pulls in toward the 1:1
5. KWAJ RESULTS – 100 km, Seasonal Bias Comparative rain amounts for individual seasons - generally a low bias - DJF 2005 suffers from low radar sampling - generally largest error in SON - generally best error in MAM DJF MAM JJA SON
6. FUTURE Upgraded TMPA-RT is in beta test - adding MHS (NOAA18 and MetOp) - RT calibrated to V.6 with trailing month calibration Future improvements - recalibrated F15 SSM/I - F16 (although issues) and later SSMIS - reprocessed AMSU-B record in V.7 TMPA (or sooner?) - “Early” RT run - extension to high latitudes for both estimates and validation - shift from SGI Unix to Linux platform
7. SUMMARY Design and implementation choices are reflected in the results - the histogram of fine-scale values and large-scale bias approximately match the calibrating sources - where this isn’t true, it traces to limitations in one of the input data sets - pattern differences among estimators are carried into the final product KWAJ radar seems ready to provide validation studies for tropical ocean Future improvements - Additional sensors - RT calibration to V.6 - AMSU-B revision - “Early” RT run - extension to high latitudes Discussion - Definitive AMSR-E status site - In-line or near-line quality control for precip products george.j.huffman@nasa.gov http://precip.gsfc.nasa.gov
AMSR-E Command Error “Anomalous data was caused by a command error in the process for SPC error recovery” (JAXA). The 89 and 36 GHz channels were affected for 01:15 Nov. 27 – 03:15 Nov. 29 2007 UTC Errors were obvious over open water, but seem likely over land A significant number of algorithms posted bad results before we caught the problem - TMPA-RT was ~36 hr Notes - what is the definitive AMSR-E status site? - in-line or near-line QC is helpful - reprocessing must be possible, even for real-time data Aqua 36V 11/28/07 1650Z J. Hawkins NRL/Monterey from NRLTC site 3B42RT 11/27/07 gauge 11/27/07 B. Ebert BMRC from BOM validation site
3. INTER-SATELLITE CALIBRATION (cont.) TCI is used to calibrate Version 6, TMI the RT The TCI performs better than the TMI - TMI histogram (dash-dot) has a peak around 2 mm/hr - TMI (+) tends to bias low at the higher rain rates
5. KWAJ – Accumulated vs. Instantaneous Rates Single radar shots at the nominal satellite times give significantly less light precip, but differences are small above about 2.5 mm/hr - year-to-year variability - still need to be more quantitative