Download
1 / 37
380 likes | 478 Views
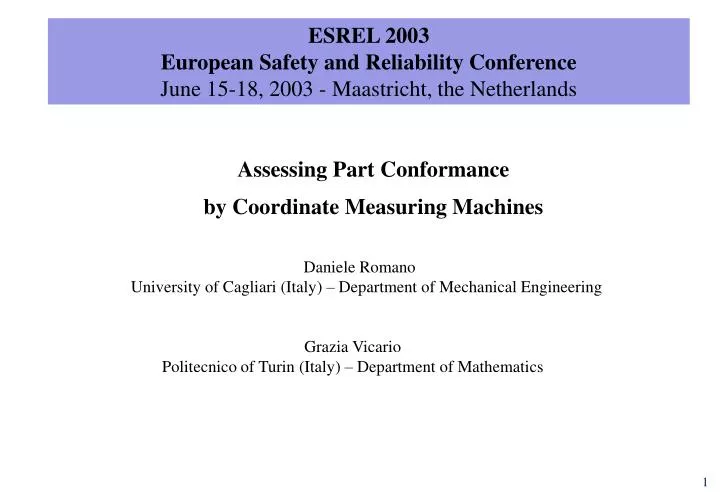
ESREL 2003 European Safety and Reliability Conference June 15-18, 2003 - Maastricht, the Netherlands. Assessing Part Conformance by Coordinate Measuring Machines Daniele Romano University of Cagliari (Italy) – Department of Mechanical Engineering Grazia Vicario

E N D
ESREL 2003 European Safety and Reliability Conference June 15-18, 2003 - Maastricht, the Netherlands • Assessing Part Conformance • by Coordinate Measuring Machines • Daniele Romano • University of Cagliari (Italy) – Department of Mechanical Engineering • Grazia Vicario • Politecnico of Turin (Italy) – Department of Mathematics
Problem and objectives • Study of uncertainty of industrial measurement processes and its implications on process design Problem • Analysis of uncertainty in position tolerance check of manufactured parts on Coordinate Measuring Machines • Optimal allocation of the measurement points on the part surfaces Objectives
The research area (Metrology, Statistics, Engineering Design) Product/Process Measurement Instrument Measurement Process Simulation Monte Carlo simulation DOE Computer Experiments Robust Design Statistical Inference ... Regulations & Standards Methods & Techniques Driving force Analyze Uncertainty Design better Product/Process Objectives
What’s a CMM? Inherent sampling error • Orthogonality errors between slides • Form errors of slides • Non-linearity of amplifier response • Errors due to the approach angle of the touch-ball • …. SYSTEMATIC Errors in Measurement RANDOM
The hole location problem • Planes A, B, C, definfìing the reference system, are ideal mating surfaces which real part surfaces are contacted with in the referencing order (A first, then B, then C) • Nominal hole axis is perpendicular to datum A and displaced by Xc and Yc from datum C and B respectively. • Actual hole axis isthe axis of the ideal largest size pin able to enter the hole perpendicular to plane A
Our measurement process 1. Estimation of datum A (envelope to the part surface) 2. Estimation of datum B (envelope) 3. Estimation of datum C (envelope) 4. DRF origin is obtained by intersection of the three datums 5. Probing points on the hole surface 6. Projection of points on datum A 7. Estimation of the largest size inscribed circle
Calculating position error Measured points projected on datum A Plane of datum A Y ep Cact Yc Cnom Inscribed circle DRF origin Xc X
Acceptance rule • epeq = ep (dact dmin)/2 t/2 Deterministic Probabilistic an uncertainty measure Identifier of Maximum Material Condition (MMC)
Outline of the study • The real measurement process is replaced by a stochastic simulation model (Romano and Vicario, 2000). In the model: • Measurement errors on the coordinates returned by the CMM are considered additive and described by i.i.d. normal random variables with zero mean and common variance, s2 = 0.0052 mm2. • The part has no error. • Experimentation is conducted on the simulation model investigating how uncertainty in the measure of the position error is affected by the number of points probed on the surfaces (control factors) and by part geometry (blocking factors). • A Monte Carlo simulation (N=104) is run at each experimental trial to have a reliable estimate of uncertainty.
The experiment Random error uncertainty in the measure of position error Simulation model Number of points probed on each surface Measurand geometry Device variables Dimensions in mm
Patterns of measurement points On planes On hole surface Helix array
The uncertainty measure A convenient representation for position error is the polar one, ep = reiq and a suitable measure of uncertainty for ep is the area of a conjoint confidence region I of the two-dimensional random variable (r, q) at a (1-a) level, defined as: A useful way to solve the integral is by using conditional distribution fr|q and marginal fq: A numerical solution is then provided by taking equally sized angular sectors and using the empirical distributions fq and fr|q (deriving from Monte Carlo simulations).
[mm] 90 0.02 120 60 0.015 150 0.01 30 0.005 180 0 210 330 240 300 270 Uncertainty depends on the angle of the position error Empirical 95% confidence region of epeq for two experimental settings Solid boundary: all factors at high level Dashed boundary: all factors at low level Finding Consequence Proposal of a different acceptance rule epeq(m)t/2 P95(epeq /q (m))
90 0.015 120 60 0.01 [mm] 150 30 0.005 180 0 210 330 240 300 270 Polarization depends on factors Empirical 95% confidence region of epeq for two experimental settings Solid boundary: most polarized Dashed boundary: least polarized
[mm] 90 0.02 120 60 0.015 150 0.01 30 0.005 180 0 210 330 240 300 270 Role of Xc and Yc Solid boundary: Xc = Yc = 50 mm Dashed boundary: Xc = Yc = 0 mm (All other factors are at the low level)
Normal score Effects on A95 Factorial effects on uncertainty Finding Consequences • Allotment of measurement points on the surfaces as adopted in industrial practice is not optimal. As an example, quota of points on the datums A, B, C are based on the 3:2:1 rule, disproved by results. • Best allotment also depends on the part geometry.
Designing efficient measurement cycles Given a prediction model for uncertainty a simple optimization problem can be defined in order to find the allotment of probed points on the surfaces (x) that minimizes uncertainty for a given part (b0 ) and a given total number of probed points (nTOT): x = (nH nA nB nC)T b0 = (w0 Xc0 Yc0 d0)T where LB and UB are bounds on x
A quadratic response surface for is estimated from the experiment ( ) and used for optimization [mm] [mm2] Two design examples b0 = (75mm 100mm 100mm 50mm)T • The part geometry is defined by: LB = (4 4 4 4)T UB = (16 16 16 16)T • Solution is sought for in the experimental range: Results
L L L L S S S S E E E E A A A A F F F F Conclusions • A statistical analysis of position error as measured by CMM has disproved a number of engineers beliefs: • Tolerance zone is a circle • Acceptance rule contains only the modulus of position error • The number of measurement points on planar datums A, B, C is best decided according to the 3:2:1 rule • The best allocation of measurement points on the surfaces does not depend on part geometry (plate thickness, boxed dimensions) • A comprehensive analysis of uncertainty is a prerequisite for an efficient design of the measurement process. Statistical methods and computer simulation seems a unique combination to cope with it.
Scientific work on uncertainty in CMM measurements • Most of the work addresses the characterization of measurement errors due to the machine and the related calibration methods to compensate systematic errors. • The basic scenario for uncertainty analysis has been proposed by PTB and then adopted also by other metrology Institutes. In the approach the first measure is taken by the real machine, all other are obtained via a computer simulation model ( “virtual machine”). • We are not aware of applications of uncertainty analysis on the design of an efficient measurement process. Practitioners routinely select measurement cycles by applying simple rules of thumb where cost is the major concern.
O C Q K P O’ Plate thickness role in position error Case #1 Plate thickness = h 4 points probed P = estimated center position PC position error Absolute reference Case #2 Plate thickness =2 h 4 points probed Q = estimated center position QC position error Datum Reference Frame Case #3 Plate thickness = 3h 4 points probed K = estimated center position KC position error C: nominal position of hole center on DRF
z y x 3D plot of the origin of the Datum Reference Frame 270.000 points Uncertainty depends on direction
45 90 800 120 60 40 600 Frequency 35 400 150 30 30 25 200 Frequency 20 180 0 15 10 5 210 330 0 0 0.002 0.004 0.006 0.008 0.01 0.012 r|q =2,5° 240 300 270 Case of the most polarized 95% confidence region
[mm] 90 0.015 45 120 60 40 0.01 35 150 30 0.005 30 25 Frequency 180 0 20 15 10 210 330 5 0 240 300 0 0.002 0.004 0.006 0.008 0.01 0.012 270 r|q =2,5° Case of maximum polarized 95% confidence region
Uncertainty Analysis Comprehensive Basic Take M measurements according to an experimental design Take the same measurement N times Replicate the experiment N times Estimate uncertainty of that measurement Estimate uncertainty in the whole sampling space Product/Process Design Knowledge of uncertainty and cost in the sampling space Design specifications (uncertainty, cost) • Select hardware components • Select parameters of the measurement process
Methodology • Planar datums in the referencing order with orthogonality constraint (Orthogonal Least Squares + shift) and estimation of the origin of the Datum Reference Frame (DFR) • Hole axis (Orthogonal Least Squares) • Position error (distance between nominal and actual axis) in DRF • Monte Carlo simulation on the ideal parts (ideal form, perfect dimensions) with a measurement error e N(0,s2), s2= 0.0052 • Study of the dependence of uncertainty of origin of DFR on the number of the inspected points on the surfaces through a 33 experimental design Estimation of features Evaluation of uncertainty of position error • Position Tolerance Check and its Uncertainty on CMM
Estimation of planar datums and origin of DRF Mathematical models Probed points on surfaces ai x + bi y + gi z + di = 0 withi = 1,2,3 Ref. C Ref. B Ref. A • Position Tolerance Check and its Uncertainty on CMM
Steps • Maximum Likelihood estimators of parameters • Orthogonal Least Squares • Non-linear problem let use a constraint (Lagrange multiplier) • Equivalent problem with • Solution: unit norm eigenvector associated to the minimum eigenvalue First Datum • Position Tolerance Check and its Uncertainty on CMM
Steps • Maximum Likelihood estimators of parameters • Orthogonal least Squares + orthogonality constraint • with the first datum • Same problem as the first datum unit norm eigenvector associated to the minimum eigenvalue • ... Second Datum + Third Datum • Position Tolerance Check and its Uncertainty on CMM
Step Envelope rule Origin of DRF • Position Tolerance Check and its Uncertainty on CMM
Results: scatterplots of the origin of the DRF 9 inspected points on actual surfaces Origins of estimated datums as envelope surfaces • Envelope rule, when form errors are comparable with measurements errors, produces a bias and increases uncertainty • Uncertainty depends on direction Origins of estimated datums with Orthogonal Least Squares • Position Tolerance Check and its Uncertainty on CMM
Why does uncertainty depend on direction? Orthogonality constraint makes a pattern! OLS lines with orthogonality constraint OLS lines with no constraint • Position Tolerance Check and its Uncertainty on CMM
90 400 60 120 300 Frequency 200 150 30 100 180 0 210 330 240 300 270 Dependence on direction suggests to express position error by a polar (spherical) transformation in the two dimensional case d(Cnominal.,Cactual)=f(,) 50 45 40 35 30 25 Frequency 20 15 10 5 0 0.005 0.01 0.015 0.02 r|q =135° • Position Tolerance Check and its Uncertainty on CMM
90° 120° 60° 150° 30° 0.03 mm 0.02 mm 0.01 mm 180° 0° 210° 330° 240° 300° 270° Results: 95% Confidence Regions n1=n2=n3=4; nc=4 n1=n2=n3=9; nc=9 • Measurement error is largely amplified • Reduction of uncertainty is heavily paid in terms of number of measurement point s=0.005 mm • Position Tolerance Check and its Uncertainty on CMM
16 55 14 70 12 60 60 55 n2 10 8 65 75 6 75 65 70 80 4 4 6 8 10 12 14 16 n1 Results: effect of the number of measured points on the flat surfaces on uncertainty (of origin of DRF) A-optimality with O = (XO, YO, ZO) DRForigins with a 33 experimental design • Position Tolerance Check and its Uncertainty on CMM
Final Remarks • Amount of uncertainty in the estimation of position error is not negligible and it may easily leads to incorrect decision about acceptance/rejection of the part, if not considered • Uncertainty depends on direction: a non trivial software module should be added to the machine • Results suggest some criticism of the envelope rule: • The tolerance zone (including uncertainty in the evaluation) looses the central symmetry • Envelope rule is unjustified and detrimental (biased estimates and increased uncertainty) when form errors of inspected surfaces are comparable with random error of CMM • Position Tolerance Check and its Uncertainty on CMM
Measurements process with CMM • CMM gives: • coordinates of a finite number of pointspertaining to contact points between a touch probe and the planar datums according to a specific order • coordinates of a finite number of pointspertaining to contact points between a touch probe and the hole surface CMM software computes coordinates and gives parameters “estimates” of probed surfaces, but the current practice does not include any uncertainty evaluation • Position Tolerance Check and its Uncertainty on CMM