Download
1 / 23
240 likes | 435 Views
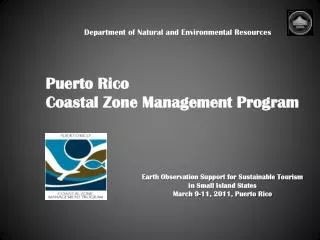
Coastal Zone Mapping for Disaster Management presented by John Copple Sanborn Map Company. Coastal Concerns and Issues. 7,500 km coast line with 3 of the top ten Urban Agglomerations (Mumbai, Kolkata, Delhi)

E N D
Coastal Zone Mapping for Disaster Managementpresented byJohn CoppleSanborn Map Company
Coastal Concerns and Issues • 7,500 km coast line with 3 of the top ten Urban Agglomerations (Mumbai, Kolkata, Delhi) • 46,000 merchant ships and 4,000 ports in addition to innumerable boats, crafts and trawlers • Half of world’s containerised fleet, a third of its bulk cargo, and two-thirds of oil shipments pass through the Indian Ocean Excerpts from "Securing India's coastline," Business Standard, Raghu Daya, January 11, 2009, 0:22 IST
Major Economic Centers • Ports • Mumbai Port • Port of Chennai • Port of Visakhapatnam • Port of Jamnagar • Port of Kolkata • and Port of Cochin
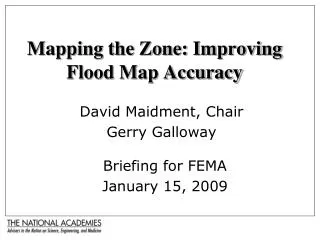
Why Plan ? “Absent a plan, one will be created for you. . . . create one so you’re not forced to deal with one you did not create.” Lisa Albanese Director of FedEx Solutions May 2007
? Resilient Community/Region Resilience Savings ? Response Recovery Create Resilient Coastline Community/ Region Functional Capacity Catastrophic Event Time Long Term Economic Savings
The Challenge is to have a Plan Manage Risk and Respond • To protect and increase the economic value and quality of life • To increase the visibility and recognitionevents and their impact • To improve the response to events • To maximize the potential of the of the urban, economic, and institutional resources. Building a Framework provides a tool for planning, evaluation of alternatives, and response management.
Coastal Mapping • What Should You Know • Topography • Landcover • Land use • Accurate Location • Infrastructure • Demographics • Natural Resources • Environment • Data Sources • Imagery • Satellite • Aerial • LiDAR
LiDARLight Detection and Ranging Aerial GPS (Global Positioning System) Based on GPS satellite triangulation, measures the location of the aircraft up to 0.1 second. Aerial sensor Collects/scans data, eitherphotons (reflected light) or laser pulses IMU (Inertial Measurement Unit) Measures attitude (pitch/yaw/roll) of aircraft every .002 second. Ground GPS Measures the location of the aircraft up to 0.1 second relative to a known ground position
LIDAR Systems –New Technology Accuracy • Requirements • Vertical accuracy required usually 9.24 -18 cm • Horizontal accuracy required usually 50 cm – 1.0m • Results • Lieca MPia, ALS-50 and Optech GEMINI • Vertical accuracy achieved: 3 – 12 cm • Horizontal accuracy achieved: 10 – 27 cm Collection • Active System allows day/night collection • Coastal areas have unique requirements • Tide
Typical LiDAR ProductsStandard, Federal , High Density • Standard LIDAR – 1.4m point spacing • General-use, high positional accuracy elevation data set. • Meets most needs for LiDAR-based DEM • U.S. FEMA Compliant LIDAR – 1.4m point spacing • FEMA Map Modernization specified product • Meets FEMA guidelines and specifications for LiDAR-based DEM • High Density LIDAR – 0.7m point spacing • Special use, high accuracy and point concentrated data set • Meets most needs for LiDAR-based DEM in very dense vegetation and terrain constrained areas
Processing Filtered LiDAR Intensity Image Raw LiDAR Data
Bare Earth Generation for Flood Plain mapping Bare Earth Data Raw LiDAR Data 0.7 meter collection specification
Contour generation from Filtered Bare Earth LiDAR and LiDAR DEM Generation for Orthorectification Bare Earth Surface Model Contours Contours Draped on Surface Photography draped over LiDAR Data Contours Draped over Orthophotography
Hydo Studies require sophisticated Breakline Generation 2 foot contours and Breaklines draped over 1 meter LiDAR generated Intensity Image
Transportation Infrastructure significantly impacts water flow 1-foot Contours Draped over Digital Image
Classification Lidar Classification Provides Significant Value • Transportation • Buildings • Infrastructure • Vegetation • Water • Forestry • Dams • Other Lake after classification and elevation averaging Bridge Modeling
LiDARgrammetry • Synthetic Stereo (3D) Imaging of LiDAR intensity data using Softcopy Photogrammetric Workstations • Applies photogrammetric principles to reverse engineer stereo perspective • Allows accurate compilation in 3D using stereo models • Classification errors readily can be readily identified for correction and/or additional data processing
Hydro Breakline Collection Process LiDARgrammetry • LIDAR Bald Earth DTM Supplemented with 3D Breaklines • 1 Foot Contours -Capable • Correctly depict the terrain • Contiguous Water Body • Linear Hydrographic • Coastal Shorelines • Road (EOP) • Overpasses and Bridges • Soft Features (ridge, tops of banks, valleys, etc) • Roof Tops/Buidlings • Islands • Vegetation
LiDAR Data • LiDAR provides a basis for improved terrain knowledge • Data for Inundation modeling • Data for storm surge • Infrastructure information • Vegetation information • Change detection