Download
1 / 21
210 likes | 333 Views
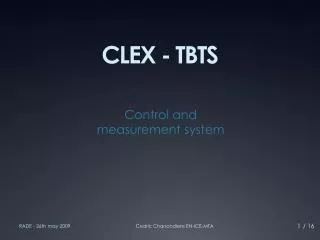
Recent TBTS measurements. W. Farabolini and the CTF3 team. Outline. ACS resonant frequency Method to calibrate time delays between diagnostics Conditioning of the newly installed ACS Acceleration with 2 ACS BDs with 2 ACS Processing of the last summer BDs data Conclusion.

E N D
Recent TBTS measurements W. Farabolini and the CTF3 team Recent TBTS measurements - RF meeting 21 November 2012
Outline • ACS resonant frequency • Method to calibrate time delays between diagnostics • Conditioning of the newly installed ACS • Acceleration with 2 ACS • BDs with 2 ACS • Processing of the last summer BDs data • Conclusion Recent TBTS measurements - RF meeting 21 November 2012
Short pulse resonant frequency Erroneous evidence of other modes (mixer saturation) Pulse length 4 ns – RF output mixed with LO at 11.8942 GHz • RF output measured on a dedicated coupler with lower attenuation • Evaluating the downshift frequency by counting zero crossings (60 pulses averaged) gives 100 MHz +/- 1 (A. Andersson.) • the downstream ACS structure is well tuned at 11.9942 GHz. • No other modes visible as previously though due to a mixer saturation Recent TBTS measurements - RF meeting 21 November 2012
Other effect possibly wrongly attributed to the ACS Horizontal BPMs signals before (brown and black) and after (blue and green) the ACS tank Pulse length 100 ns (150 bunches) bunch charge 0.13 nC (0.21 A) bunch charge 0.069 nC (0.115 A) bunch charge 0.04 nC (0.067 A) • Sudden beam kick for pulse length > 40 ns and bunch charge > 0.04 nC (67 mA) • But this is meanly due to the Califes accelerator (still to be understood) Recent TBTS measurements - RF meeting 21 November 2012
Direct evaluation of RF output downshift signal LO = 11994.2 - 10 MHz LO = 11994.2 - 3 MHz LO = 11994.2 - 2 MHz LO = 11994.2 - 1 MHz LO = 11994.2 MHz LO = 11994.2 + 1 MHz LO = 11994.2 + 2 MHz LO = 11994.2 + 10 MHz Recent TBTS measurements - RF meeting 21 November 2012
RF production with longer pulses Pulse 150 ns LO = 11894.2 MHz Pulse 66 ns LO = 11894.2 MHz Extracted Faraday cup acts as a button pick-up Pulse 194 ns LO = 11994.2 MHz • RF output frequency is of course forced by the probe beam pulse frequency • RF output rising time = ACS filling time (65 ns) • RF output rising time + sustain time = pulse length • RF output falling time = ACS filling time (65 ns) Recent TBTS measurements - RF meeting 21 November 2012
Downstream ACS Downstream ACS Upstream ACS Upstream ACS dACS dPM dFCU Cable 864 Cable 708 Cable 859 • PM ACS • PM FCU • Aquiris digitizer crate Oscilloscope • Diodes crate LO FCU Cable 859 RF couplers and beam diagnostics delays calibration Second step: measure delays between beam diagnostics and the RF special coupler First step: calibrate delays between RF output couplers dFCU = 1.025 m dPM = 0.17 m (approx) dACS = 0.426 m • The probe beam is a common trigger for beam sensitive diagnostics (BPMs, FCU, PMs) and output RF couplers (beam propagation delay is known) • Probe beam generated RF is still visible using mixer on “nominal couplers” when removing the gallery installed attenuators, but not using the diode crate Recent TBTS measurements - RF meeting 21 November 2012
Conditioning of the newly installed ACS At the beginning : many BDs in the waveguide/phase shifter Then out gazing of the ACS • We are trying to keep a reasonably soft conditioning, limiting vacuum increase as well as BD rate. • Tail clipper is efficiently used to reduce pulse length • Recirculation to increase pulse power in case of factor 4 recombination. • Most often drive beam repetition rate is set to 1.67 Hz • Conditioning program in development (stop RF power for a while after each BD, …) Recent TBTS measurements - RF meeting 21 November 2012
Acceleration with the 2 ACS RF On RF Off Energy oscillations with and w/o RF power • With more than 30 MeV gain, it is no longer possible to observe the accelerated / non accelerated beam for the same dipole strength on the spectrum line screen • Califes and RF power oscillations limit the measurement accuracy (+/- 1 MeV) Recent TBTS measurements - RF meeting 21 November 2012
TBTS layout 3 phase settings Roger Ruber • The Layout is becoming very dense • Many diagnostics, signals and settings Recent TBTS measurements - RF meeting 21 November 2012
2 phase shifters scan Poor reproducibility of the ACS phase shifter ACS phase shifter scan • For a given Califes phase vs. Drive beam, it seems that we cannot reach the maximum acceleration by scanning the inter-structures phase shifter (command/control limitation) • However the command/control is not really reproducible and “insisting” allows to enlarge the range ! Recent TBTS measurements - RF meeting 21 November 2012
Method to set the inter-ACS phase shifter RF power control Califes phase scan constant energy = Califes energy • For phase shifter at 16.86, the energy gain by the 2 ACSs is 0 whatever the Califes phase. • This shows also that the 2 ACS are opposing each other and receive the same RF power. • From this phase (measured with I/Q on input coupler), 180 deg shift is required for both structures to work together. Recent TBTS measurements - RF meeting 21 November 2012
I/Q phase measurement Input phases when ACSs in opposition ACS downstream phase (-100 deg) at upper limit switch ACS downstream phase (60 deg) at lower control • In that state of the command/control the requested position (-40 deg) is not reachable • However C/C can drift as seen before and the phase measurements are to be reconsidered with I/Q offset cancellation. Recent TBTS measurements - RF meeting 21 November 2012
BD in the 2 ACS • There are occurrences of BDs in the 2 ACS during the same RF pulse (RF reflected ?) Recent TBTS measurements - RF meeting 21 November 2012
Last summer data processingon single ACS TBTS Recent TBTS measurements - RF meeting 21 November 2012
BDR as function of RF input Power (discarding BDs within clusters) ./. P 11.5 or ./. E 23 But these dots are certainly the most interesting ./. P 3.7 or ./. E 7.4 CTF3 days - 11 October 2012
Distribution of RF power RF power density of Probability of all RF pulses (blue), of RF pulse with BD (red) and power law fit of BD probability (green) • Fitting the Power distribution when BD by a power law of the power distribution of all pulses provide an exponent between 15 and 18. Recent TBTS measurements - RF meeting 21 November 2012
FCU and PMFCU signals reliability FCU max output [V] PM on FCU max output [V] Max Transmitted Power [MW] Max Transmitted Power [MW] Max Reflected Power [MW] • OTR light seen on FCU mirror surface is current and energy dependent but not saturated. • (Blue dots correspond to low reflected power) Alexandra A. • When RF transmitted power is low (early BD), BD produced electrons are not likely to reach the FCU (not accelerated towards the FCU) • Also when RF reflected power is low FCU signal is often weak (why ?) CTF3 days - 11 October 2012
BD location and phases Stability of Input and Output phase before BD Recent TBTS measurements - RF meeting 21 November 2012
Ref / In phases evolution with time • Phase difference between the Reflected and Input RF taking into account the delay according to BD position • No clear information yet to be derived from phase Recent TBTS measurements - RF meeting 21 November 2012
Conclusion • The two ACS are still under conditioning (40 MW reached) • Their behavior seems nominal • The acquisition chains have required some effort to host the additional signals and calibration are still improving • More efforts are necessary to adapt the BD data processing routines to all the 2 ACS signals • Analysis continue on the former single ACS data • A lot of work is to come (BDR studies, WFM, Flash Box, kicks…) THANK YOU FOR YOUR HELP Recent TBTS measurements - RF meeting 21 November 2012