Download
1 / 73
740 likes | 875 Views
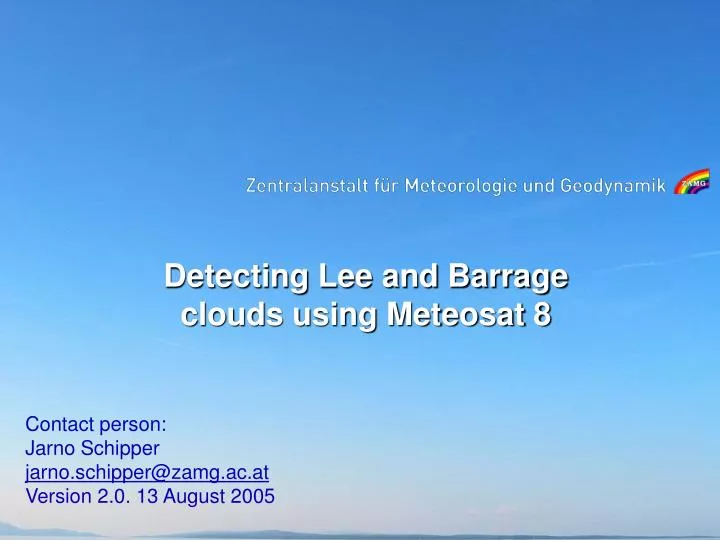
Detecting Lee and Barrage clouds using Meteosat 8. Contact person: Jarno Schipper jarno.schipper@zamg.ac.at Version 2 .0. 13 August 200 5. Example I Lee clouds over Norway: 28-6-2005. Meteosat 8 IR10.8: 28 June 2005: 0200UTC. Meteosat 8 IR10.8: 28 June 2005: 0230UTC.

E N D
Detecting Lee and Barrage clouds using Meteosat 8 Contact person: Jarno Schipper jarno.schipper@zamg.ac.at Version 2.0. 13 August 2005
Meteosat 8 IR10.8: 28 June 2005: 0600UTC The development of the lee clouds (green arrows) behind the mountain ridge can clearly be seen. Click back and forth! Lee clouds appear white in IR imagery and can sometimes be confused with MCSs. An animation, or satellite loop however is decisive
Meteosat 8 RGB: HRVis +HRVis + IR10.8: 28 June 2005: 0600UTC The HRVis RGB is build of two times HRVis channel on Red and Green and the IR10.8 on Blue. The last channel gives the additional temperature profile information. The lee clouds are consistant of blue and darkblue colors which thus means that the contribution of the IR channels is high, thus the lee clouds here are consistant of multilayered to highreaching clouds consistant of iceparticles. Slightly above the upper arrow Lee waves can be spotted.
Meteosat 8 RGB: NIR1.6 +VIS0.8 + VIS0.6: 28 June 2005: 0600UTC A final RGB made of NIR1.6 on Red, VIS0.8 on Green and VIS0..6 on blue indicates that the lee clouds found over Norway are blue. This means that the clouds are consistant of multilayered highreaching ice clouds.
Meteosat 8 IR10.8: 12 April 2005: 0000UTC The green arrows mark the positions of interest. Two seperate areas developing lee clouds were identified. Again one over Norway, but now also over Scotland. A closer look over Scotland even reaveals Lee Waves ( red arrow).
Meteosat 8 IR10.8: 18 March 2005: 03300UTC The red arrow indicates lee waves. Normally these are better seen in HRVis
Meteosat 8 IR10.8: 18 March 2005: 0600UTC The green arrows mark the positions of interest. Especially around the Alps in Austria and Swiss Lee clouds and Barrage clouds often occur. The sharp border in the cloudiness caused by the mountainbarrier can nicely be seen.
Meteosat 8 RGB: HRVis + HRVis + IR10.8: 18 March 2005: 0730UTC The HRVis RGB indicates the lee clouds as blue and darkblue. This is a sign that the lee clouds are consisting of highreaching iceclouds. The lee waves are indicated here with the red arrows. Especially in this RGB they are easily picked up.
Meteosat 8 IR10.8: 8 May 2005: 1200UTC The green arrows mark the positions of interest. In this example the stationary position of the lee clouds are very nice visible.
Meteosat 8 RGB: HRVis + HRVis + IR10.8: 8 May 2005: 1200UTC In this HRVis RGB the lee clouds are pictured in blue. The contribution blue by the IR10.8 channel is high. This correlates to the fact that the lee clouds are consistant of high cirrus (iceclouds).
Meteosat 8 RGB: NIR1.6 + VIS0.8 + VIS0.6: 8 May 2005: 1200UTC In this RGB the lee clouds appear as lightblue. They indicate multilayered high reaching iceclouds.