Download
1 / 18
180 likes | 308 Views
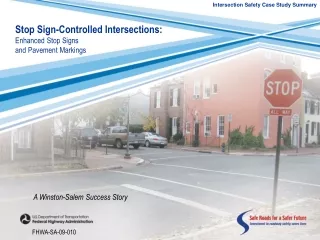
Low Cost Safety Improvements Pooled Funds Study Safety Evaluation of STOP AHEAD Pavement Markings. Dr. Frank Gross, Vanasse Hangen Brustlin (VHB), Inc. Overview. Introduction Objective Study Design Data Collection Results Economic Analysis Conclusions. Background on Strategy. STOP AHEAD

E N D
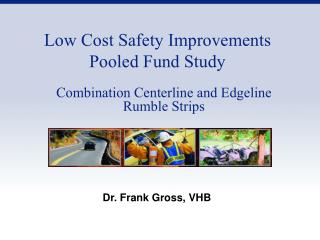
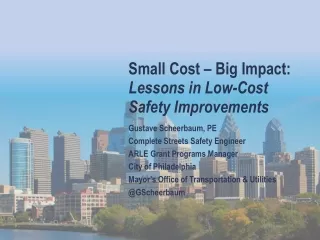
Low Cost Safety Improvements Pooled Funds StudySafety Evaluation ofSTOP AHEAD Pavement Markings Dr. Frank Gross, Vanasse Hangen Brustlin (VHB), Inc
Overview • Introduction • Objective • Study Design • Data Collection • Results • Economic Analysis • Conclusions
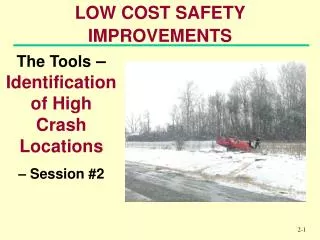
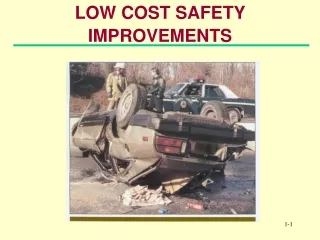
Background on Strategy • STOP AHEAD • Tried • Low cost • Short-term implementation • Target crashes • Right-angle • Rear-end • Other STOP sign violation crashes • Potential Difficulties • Visibility in winter • Low coefficient of friction • Key to Success • Maintenance of markings
Literature Review • STOP AHEAD pavement markings • No available literature • STOP AHEAD signs • Several studies • Not particularly effective (Zwahlen, 1988)
Objective • Estimate Safety Effectiveness • Total crash frequency • Target crash frequency • Right-angle collisions • Rear-end collisions • Injury collisions • Questions of Interest • Do effects vary by: • Traffic volumes? • Area type? • Number of approach legs? • Number of stop-controlled approaches? • Is the treatment economically feasible?
Study Design • Required Sample Size • Minimum: 53 intersection-years • Detect 20 percent reduction in total crashes with 90 percent confidence • Desirable: 260 intersection-years • Detect 10 percent reduction in total crashes with 90 percent confidence • Assumptions • Number of reference sites = number of strategy sites
Data Collection – Arkansas Total number of intersections used = 8
Data Collection – Maryland Total number of intersections used = 9
Data Collection – Minnesota Total number of intersections used = 158
Evaluation Results Aggregate Analysis Note: A negative sign indicates an increase in crashes. Bold numbers indicate a statistically significant effect (95% confidence level).
Evaluation Results Aggregate Analysis Note: A negative sign indicates an increase in crashes. Bold numbers indicate a statistically significant effect (95 percent confidence level).
Evaluation Results Disaggregate Analysis Note: A negative sign indicates an increase in crashes. Bold numbers indicate a statistically significant effect (95% confidence level).
Economic Analysis Determine the Annual Cost of Installation • States Provided Installation Costs and Service Life • Latex: $140 per approach (2 year service life) • Thermoplastic: $1,500 per approach (5 year service life) • Convert Installation Cost to Annual Cost • Latex: $78 per approach/year • Thermoplastic: $366 per approach/year
Economic Analysis Estimate Crash Costs • FHWA Unit Crash Cost Data (Council et al., 2005) • $58,832 for undefined collision • Includes “hard dollar” and “non-monetary” costs • Assume 2:1 Benefit-Cost Ratio • Required Crash Reduction (2:1 Benefit-Cost Ratio) • Latex: 0.005 (Two-way stop- controlled) or 0.011 (All-way stop- controlled) • Thermoplastic: 0.025 (Two-way stop- controlled) or 0.050 (All-way stop- controlled)
Conclusions • Total Crashes • Significant reduction in AR, MD, and overall • Right-angle and Rear-end Crashes • Significant reduction in AR • Injury Crashes • Significant at 10 percent level overall • Disaggregate Analysis • Greater effect for 3-legged (highly significant) • Greater effect for All-way stop-controlled (highly significant) • Some variation by AADT
C R A S H E S Conclusions • General Reduction in Crashes • Results supported by MN data • Economically Feasible • Low cost strategy • Modest reduction to achieve 2:1 Benefit-Cost ratio • Necessary reduction is easily achievable Benefit >> Cost
QUESTIONS or COMMENTS