Download
1 / 64
640 likes | 855 Views
Education vs. Training Train = prepare against surprise. Educate = prepare for surprise. ( Finite and Infinite Games. James P. Carse , 1986). Information i s a Commodity. Non-official statistics (down the rabbit hole). Fun Questionnaire: goo.gl/oRNg0h. Worksheet: goo.gl/ krkEi.

E N D
Education vs. Training Train = prepare against surprise. Educate = prepare for surprise. (Finite and Infinite Games. James P. Carse, 1986) Information is a Commodity Non-official statistics(down the rabbit hole) Fun Questionnaire: goo.gl/oRNg0h Worksheet: goo.gl/krkEi David Sulz, Public Services Librarian University of Alberta 2014 Winter Institute on Statistical Literacy for Librarians
Statistical Literacy revisited • Information literacy is … • "recognize when information is needed and have the ability to locate, evaluate, and use effectively the needed information." • Determine extent of info needed • Access needed info • Evaluate info and sources critically • Incorporate selected info • Use info to accomplish a specific purpose • Understand economic, legal, and social issues (access and use ethically and legally) • ACRL: Information Literacy Competency Standards for Higher Education. • www.ala.org/acrl/standards/informationliteracycompetency
Statistical Literacy is… • Ability to read and interpret numbers in statements, surveys, tables, and graphs. • media, public policy, advertising • Critical thinking about numbers and statistics used as evidence in arguments. • association/correlation vs. causation. http://xkcd.com/552/ • errors, weasel words, and vague claims • frequently (count) vs. likely (probability) • real statistics vs. speculative statistics • definitions of a group (Statistical Literacy: A Short Introduction http://www.statlit.org/pdf/2010Schield-StatLit-Intro4p.pdf)
Problems? http://olympics.cbc.ca/medals/index.html. Retrieved 12 Feb 2014
Intuitive statisticians? • “Are people good intuitive statisticians?” • Good intuitive grammarians? Yes. • Statisticians? No. • See Daniel Kahneman’sThinking Fast and Slow (2011) for many fascinating examples. • Fun Questionnaire: goo.gl/oRNg0h
Intuitive Probability • East group: • Which is more probable? • Linda is a bank teller • Linda is a bank teller and an active feminist? • West group: additional information • Linda is 31 years old, single, outspoken, and very bright. She majored in philosophy. As a student, she was deeply concerned with issues of discrimination and social justice, and also participated in antinuclear demonstrations. • (Daniel Kahneman. Thinking Fast and Slow. 2011)
Review Official Statistics • Governmental sources • formal / legislated mandate to gather and process statistical information = “special, official status” • Sources: administrative records, national surveys
Non-offical statistics • a.k.a. non-governmental statistics • = statistics that are not • “official statistics” • “No, seriously, what are they?” • Q1) Who are they produced by? • Q2) What do they cover? ;-)
Coverage? • Different areas • markets, sectors, products, populations • More detail • New markets and interests • Different types of data
“THE” starting point Who might care?
Who produces them? • trade/industry associations • professional bodies • interest groups • academic institutions / academic researchers • research institutes / think-tanks • economic research & forecasting institutes • chambers of commerce / econ dev’t offices • financial services companies • banks, insurance, brokerage firms • commercial publishers • market research organisations • consultants • opinion polling firms • media
Who produces them – II • Cartoonists and humorists
Caveats - Quality • Quality • Reliability and accuracy varies • Accountability and scrutiny • Blurring lines • official stats distributed by private sector • official series incorporate non-official • “private” sector contracts official agency • Cost recovery survey may not include funding for tables, analytical work, PUMFs, etc • Max or Min: over- or under-report? • admin records vs survey response
Caveats - Purpose • Purpose: • Logic ---------------------- Rhetoric (thought / analysis) (instruct /persuade) • How? • selected presentation of results • built right into the question Push Poll • “designed to plant opinions rather than harvest them”
Push Poll example • “If you knew the borscht at the café next door was made with cat-urine stock, would you be more or less likely to dine there?” • Southey, Tabatha. “Don’t judge the Tories’ push-me, poll-you tactic.” The Globe & Mail. Saturday, Feb. 9, 2013. F3
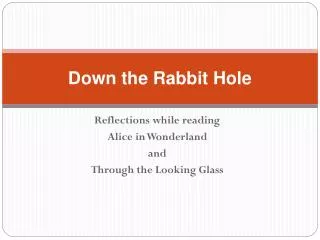
Caveats - Scale • Scale and Magnitude • UK, regularly produced : >900 sources, 440 orgs. • (Sources of non-official UK statistics. 2005) • BTW: google search “non-official statistics canada” • statistics on non-official languages in Canada from census! “Either the well was very deep, or she fell very slowly, for she had plenty of time as she went down to look about her and to wonder what was going to happen next.” n.b. The “well” IS very deep but you may not have plenty of time!
Caveats - Accessibility • Accessibility • Synopsis in press release, article, website, report • Details only to clients, members, participants Options: • Free • Institutional affiliation, Personal affiliation • Purchase • DIY (collect, analyse)
Free vs Fee • 1) By def’n, non-official not paid by us (taxpayer). • Collected or paid by someone else for their own purposes • 2) Ask self, “why would this be offered free?” • Expensive to collect, process, and disseminate • Promotion? Already paid by another means? • 3) You can always do it yourself! • Aggregate from various sources (e.g. annual reports) • Design own survey (http://www.ejca.org/) • Commission a survey
Free • “the sides of the well … were filled with cupboards and book-shelves ... • She took down a jar from one of the shelves as she passed; it was labelled `ORANGE MARMALADE', • but to her great disappointment it was empty.”
Fee • “There were doors all round the hall, but they were all locked. Suddenly … a tiny golden key … but, alas! either the locks were too large, or the key was too small.” • “On the second time round, … a passage into the loveliest garden you ever saw. How she longed to get out of that dark hall, and wander about among those beds of bright flowers and those cool fountains, but she could not even get her head though the doorway.” • (“and even if my head would go through…it would be of very little use without my shoulders.”)
Exploration • How much do aircraft, avionics, and space technology companies spend on R&D? • Brainstorm: in groups of 2-4 • goo.gl/krkEi
AIAC Statistical Highlights Q: What year are the statistics for? Q: What is the source? Q: What does “aerospace” cover? Q: Comments on quality of statistical information?
Associations • Industry statistics & economic indicators: • Sales figures • Production rates • Export/import facts • Market share rankings • Demographics • Consumer spending habits • Surveys
Exploration Any issues with this chart?
Consulting / Professional firms Q: How was the information for this graph collected? Q: What year? Q: What population was sampled? Q: Any issues with methodology? goo.gl/krkEi
Market research agencies $1000s, to $10,000s and limited use rights
Passport GMID • (a.k.a.) Global Market Information Database • Life sciences researcher wants market information for a new, minor ear wax “issue” treatment (not swab). • Key market players? • Dominant brands? • Sales forecasts ? • Potential international markets to target? • (instructor-led brainstorm) goo.gl/krkEi Q: What units of observation?
GMID issues • Permission screen • 2.2. No form of commercial use of market reports, articles, written materials and data is permitted. You may not publish, re-distribute or make available to third parties any such content which you extract from this service, whether by itself or as part of any work or other material. • Q? What about an academic researcher wants to include in conference presentation, conference proceedings, and published paper? • A: UofA license: "To reproduce insubstantial and limited amounts of the Intelligence in the Authorised User's own course work, reports, essays, projects and similar materials which he or she creates for academic purposes only. For the avoidance of doubt this includes use in scholarly publications, and discussion or presentation of such research or publications at academic conferences".
GMID exploration Q: Get your head around each section and report to group’
Exploration • What are the viewer demographics for the TV show “Biggest Loser”? • Brainstorm: Who would care? goo.gl/krkEi
PMB • - library.ualberta.ca databases PMB • note instructions • see “how to read a PMB report” • What are the viewer demographics for the TV show “Biggest Loser”? Q: Is “demographics” an appropriate request? Q: Observations on the questionnaire and collection format used to generate the information. Opt. Q: What are Edmonton’s top 3 coffee shops. Opt Q: Is there a regional difference between Blackberry and iPhone ownership?
From the bottom up • Ipsosi-say Panel (www.i-say.com) • exposure to variety of surveys: wording, intents, etc • Sign yourself up? • Canadian Financial Monitor • View actual survey goo.gl/ssZ2L • Internet search WealthScapes 2013 Reveals Rising Fortunes • Wealthscapes
Prizm C2 Lifestyle Lookup • https://en.environicsanalytics.ca/prizmc2_cluster_lookup.aspx
Insurance Companies • Sun Life Canadian Health Index • Canada score = 68.5 • Perceived health index = 70.9 • Attitudinal health index = 67 • Behavioural health index = 67.7 NB: for more information on the survey contact: Corporate.Marketing.and.Communications@sunlife.com” Q: Better information from official sources?
Financial institutions Nearly half of Canadians approaching retirement consider their legacy, Investors Group poll finds “The legacy Canadians plan to leave to charitable and non-profit organizations will average about 28 per cent of their financial assets according to the Investors Group poll, regardless of age.”
Exploration • “Breast cancer is the leading cause of death among women in Canada” • Brainstorm: non-official sources goo.gl/krkEi
Charities 14.4% of 29.6% = 4% maximum Diseases of the heart, Lung cancer Cerebrovascular disease Lower respiratory Accidents
Time of Murder • For a prize: (write name on sheet) • what country? • what source? • official, unofficial, non-official, other (specify)
Survey / polling indexes • iPoll Databank (Roper Center, Public Opinion Archives • - library.ualberta.ca databases Japan earthquake • Odesi.ca • digital repository for social science data, including polling data. • search metadata then contact data producer directly. • www.aapor.org/Poll_andamp_Survey_FAQ/5511.htm
Data Repositories • e.g. SSHRC has adopted a policy to facilitate making data that has been collected with the help of SSHRC funds available to other researchers… • …must be preserved and made available for use by others within a reasonable period of time(e.g. 2 years) • (SSHRC, Research Data Archiving Policy)
Exploration (opt) • What’s the economic climate like in Edmonton these days? • Brainstorm: goo.gl/krkEi
Chambers of Commerce /Economic Development Organizations Q: Which Edmonton Monthly Key Economic Indicators stats are from official sources and which from non-official? goo.gl/krkEi
Research Institutes/Think tanks Q: Can you replicate this chart? goo.gl/krkEi