Download
1 / 29
290 likes | 485 Views
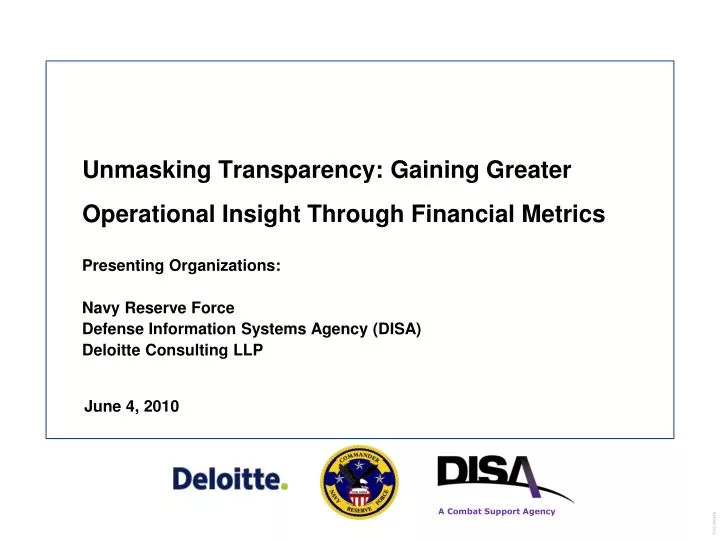
Unmasking Transparency: Gaining Greater Operational Insight Through Financial Metrics. Presenting Organizations: Navy Reserve Force Defense Information Systems Agency (DISA) Deloitte Consulting LLP. June 4, 2010. Introductions. Paul Branum Comptroller, Navy Reserve Forces

E N D
Unmasking Transparency: Gaining Greater Operational Insight Through Financial Metrics Presenting Organizations: Navy Reserve Force Defense Information Systems Agency (DISA) Deloitte Consulting LLP June 4, 2010
Introductions Paul Branum Comptroller, Navy Reserve Forces Paul leads the finance organization for the $1.7B Navy Reserve Operations and Personnel Budget. Christopher Rose Principal Chris is a lead Principal in the delivery of Finance Transformation and Service Delivery Transformation engagements for DoD clients. • Fifteen years of federal financial management experience at HQ level activities • 24 years as a Navy Surface Warfare Officer • Master’s Degrees in Business Administration and Public Policy • 17 years of financial management experience spanning all dimensions – people, process, systems, & technology • Former Presidential Management Intern (PMI) for the Department of the Army Nathan Maenle Business Systems Executive, Defense Information Systems Agency Nathan leads the integration and evolution of Agency business systems. • Works directly with the CIO to shape business policy and manage business information and data • Supported integration of worldwide DISA Directorate’s processes and systems driving $13M capital investment • Twenty years as Information Systems Specialist
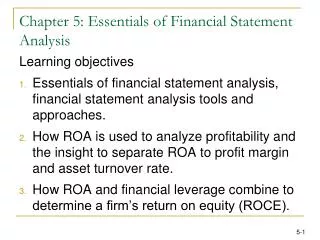
Objectives Introduce the foundational concepts of performance management Define and explain common performance management terms providing relevant examples Explain the four critical components of performance management Explain how management can align people’s behavior with their corporate strategy through operational goals Present case studies that illustrate the concepts in action Session Overview
DoD future years budget projections present a concerning situation for every organization in the Department
Performance Challenges • How can I manage my responsibilities to focus on the activities that create real valuefor the organization and make a quick, noticeable impact? • How do I ensure that the data the organization relies on provides the most useful information? Execution Challenges • How do I create a common language that empowers management to see itself the way outside stakeholders do? • How should I organize my team and interact with business leaders to embed financial disciplines and support value-creation activities? Efficiency Challenges • How do I attract, develop, and retain the talentrequired to execute our mission efficiently? • How do I drive innovation and improved performance inmy operation? Risk/Control Challenges • How do I ensure that the reporting data the organization relies on is accurate so that the organization delivers a reliable dial tone (information)? • How do I remain compliant without increasing the workload burdenon my organization? In addition to fiscal concerns, DoD financial management organizations are experiencing competing challenges across various areas
In response to these challenges, DoD financial management needs to accelerate evolution from value preservation to value creation • A “Moment of Truth” for DoD Financial Management… The Shift From Value Preservation... • Value preservation has been achieved primarily through Finance’s focus on stewardship and budget development capabilities. • Financial management office responsibilities were to ensure that the people, processes, controls and technology existed to ensure accurate documentation of all transactions and support budget justification. • Financial management personnel collected, consolidated, and verified data. ...to Value Creation • Today, financial management offices can take advantage of new technologies to shift their focus to becoming a more valued business partner. • Providing deeper and more consistent analytical insight into the operations of the business and how to improve them. • Financial management organizations are expanding their responsibilities to contribute to determination of strategic business direction and stimulate the right behaviors across the organizationin pursuit of corporate objectives through performance management.
Business Performance Management Corporate Performance Management Performance Management Value Based Management Strategic Enterprise Planning Business Intelligence Balanced Scorecard Business Enterprise Planning Scorecarding and dashboards Strategic Cost Management One such method to accelerate “value creation” is to improve the effectiveness of performance management in our organizations Performance management is characterized by many names in the Federal marketplace and several slightly different definitions Performance management consists of a set of management and analytic processes, supported by technology, that enable organizations to define strategic goals and then measure and manage performance against those goals.
Effective performance management translate strategic objectives into operational results through a lens focused on “value creation” What is the objective? The objective of any performance management process is to bridge strategy and execution by linking corporate strategy with people’s behavior through operational goals and rewards What is the value? • Improved decision making • Improved performance • Aligned organizational behaviors • Enabling the organization mission How is it done? Combining the power of information, people, process and technology through all stages of the management cycle
A foundational step is to understand an organization’s information and its hierarchical nature The types of information required for decision making depends on: • The level of the organization it is generated for (Employee, Management, or Executive), • The type of decision it is intended for (Operational, Tactical, or Strategic) • The end user (External Customer or Internal Consumer) Integrated, Relevant Information Internal Consumers InformationHierarchy External Consumers External Stakeholders – OMB, Congress, Component Leadership Decision Types Organization Levels Level 1 Executive Committees Strategic Decisions Strategic Information ExecutiveLevel The Regulators – OSD Level 2 Senior Managers Partners Level 3 Middle Managers TacticalDecisions Management Information ManagementLevel Customers Suppliers Other Middle Managers and Supervisors OperationalDecisions Transactional Information EmployeeLevel Partners Customers Suppliers Individual Contributors
Information is evaluated using measures, metrics, or indicators, each of which has a different implication on decision making High Low Value of information to decision making
Measures, Metrics, and Indicators can be of different types - financial or operational, and leading or lagging • There could be a plethora of measures, metrics, and indicators in an organization • The measures, metrics, and indicators to be considered are the ones that quantify the impact of decisions or actions in alignment with value creation and corporate strategy.
A more balanced performance measurement model uses measures, metrics, and indicators defined from different perspectives in the organization • Most strategies focus first on stakeholder value (using financial metrics for performance measurement) and then on the value to other stakeholders such as customers, suppliers, and employees • A robust performance measurement approach balances these views Financial Employee Lagging metrics Leading metrics Absenteeism Morale Growth Learning Turnover • Fulfillment cost • Customer service cost • Number of travel • orders issued Cost per Voucher Total Cost of Voucher Processing Operational Customer Satisfaction Retention Total Customer Experience (TCE) Vouchers Processed Per Month Line of Accounting Per Voucher *The Balanced Score Card: Measures that drive performance HBR, July 2005
Performance Measures: Rules of the Road • All performance measures should meet a number of key criteria: • Relevant: Directly linked to critical objectives and strategies • Reliable: Verifiable and free from subjective judgment or bias • Valuable: Able to help management make decisions and take actions • Timely: Available before it loses its capacity to influence decisions • Cost Effective: Benefits of using measure outweigh the costs of collecting and reporting the information • Availability: Data to support the performance measure is available
Successful performance models consist of four components: Information, Processes, People and Organization, and Tools and Technology Information Process Performance Management Strategic Objectives Tools and Technology People
A developed performance management landscape follows the guiding principles of focus, alignment, integration, and behavior Focus Alignment Integration Behavior “Doing what matters” “Pulling in the same direction” “Talking the same language” “With everybody on board” • Shared understanding of value creation across the organization • Identified key value drivers linked to strategic directive • Planning, execution, and measurement of what matters • Clear management control and accountability • Project portfolio and initiatives linked to value drivers • Targets cascaded throughout the organization • Planning, measuring, and intervention processes interlinked • Incentives and rewards for organizations and people embedded in the performance management system • Comprehensive information strategy and supporting technology architecture • Raise awareness of targets • Establish performance incentives • Deploy and develop talent
A maturity matrix for performance management can help guide further development Advanced Developing Defined • Performance data is regularly communicated/ • provided to all • Performance data is kept among management team, not communicated/provided • Performance data is only sporadically communicated/provided to stakeholders Process • Bullet points • Bullet points • Bullet points • Statutory and multi-dimensional management reports; Comparisons of actual cost to standard cost actual, budget, and forecast results • Reports focused on statutory requirements and basic actual to budget comparisons • Statutory reports complemented with multi-dimensional management Reports provide actual, budget, and forecast results Info • Managers are held accountable for those measures for which they have control • Executives are held accountable for financial results only • Measure owners are identified but not accountability below the Executive level People • Data warehouse as the foundation for single version of the truth • Reports developed through export to spreadsheet application • Reports are developed and produced directly from the ERP system Tools and Tech
Department of the Navy Commander, Navy Reserve Force (CNRF) Financial Metric Maturity Within the Navy Reserve
As a multi-echelon, geographically-dispersed organization, the Navy Reserve provides a unique and challenging environment for driving change
Similar to many DoD organizations, CNRF was confronted with a number of environmental factors driving a need for change in the way we do business • Relocation of CNRF HQ operations have created challenges for obtaining visibility into organization operations and retaining key resources BRAC Relocation of HQ Leadership/ Staff Turnover Changing Support for Wars Case for Change Defense against Budget Marks Leadership Focus Greater Scrutiny of Training Funds Support of Active Fleet Strategic Performance Measurement • Wars in Iraq and Afghanistan have increased scrutiny on resource allocation and utilization • Demands for improved financial performance have been driven by regulatory and organizational oversight
ASN(FM&C) established financial performance metrics were cascaded throughout the Department. Elements of the Financial Efficiency Index (FEI) were included in the Office of Chief of Naval Reserve (OCNR) Strategic Plan. CNRF developed a Field Level FEI Scorecard to institute a more aggressive focus on financial performance. Changing requirements, added demands, and fiscal constraints directly impacted the Military Personnel budget - estimates have declined by $300 million between FY 2007 - 11. This trend holds true forReserve Personnel Navy (RPN) with budget estimates declining by $45.1M. FY07-10 Unexpended Congressional Marks to the RPN account were $54M. Source: Pres. Bud. Book Evolving demands began to require overall organizational focus to shift from routine reporting to evaluation of funds management performance Military Personnel Budget Estimate Reductions ASN(FM&C) FEI OCNR 2010 Strategic Plan OCNR Strategic Plan ASN (FM&C) FEI
The prospect of losing additional budgetary resources in future years drove the need for a more in-depth look into the execution trends within the major Navy Reserve programs. Analysis of preliminary enterprise-level metrics led to the identification of key focus areas for improving the financial performance of the overall organization. CNRF began to align with these changing priorities by making strategic decisions about evaluating critical programs and measuring performance Funds Management Financial Accountability Identified Focus Areas • Inputs: Obligations • Expenditure/ • Disbursements • Lapsing Appropriation Balance • 1517 Violations CNRF FEI Legacy Financial Systems Workforce Skill Sets 34.1% Leadership Dashboard
Benefits Actions Taken Improvement Objectives Further evaluation of enterprise-level financial metrics led to the identification of specific improvement objectives within the identified focus areas • Developed semi-automated tools to support process specific financial management activities • Drive accountability for managing activities affecting funds execution to the process-level • Improve efficiency with which legacy system financial data can be analyzed and reported • Improved field-level visibility into measurements of financial management performance • More efficient use of Funds • Increased timeliness in identifying and resolving required actions RPN Travel Tool Aviation Fuel Tool • Improve alignment of job requirements with identified skills sets • Increase workforce’s ability to analyze and manage financial data and associated funds • Advanced ability to effectively reduce ineffective use and management of organization funds • Greater reliance on workforce to affect the activities driving organizational performance metrics • Began preliminary steps to initiate workforce competency assessment Workforce Competency Development
As visibility into CNRF processes and performance continues to mature, the organization is taking a more integrated approach to performance measurement Next Steps: -Continue to integrate and automate performance measurement tools into CNRF operations - Initiate workforce competency assessment to identify key financial management skill set requirements Timeliness Depth of Analysis Developing Defined Advanced • Manually developed enterprise-level metric set • Limited ability to identify underlying metric drivers • Financial data obtained from multiple supporting systems for analysis • Web-based process specific management dashboards • Visibility into process specific data • Semi-automated data integration and analysis from disparate systems • Comprehensive, multi-dimensional measurement of financial data • Customizable, near-real time display of performance metrics • Dynamic integration of financial data from multiple sources
DISA BI Evolution Mr. Nathan Maenle Business Systems ExecutiveOffice of the CIO June 2010
Defense Information Systems Agency ACQUIRE DELIVER OPERATE Planning Resources Spectrum • Enterprise Infrastructure • C2 & Information Sharing • Operate and Assure Testing People Acquisition Contracting Engineering Info & Knowledge Mgmt Leaders enabling information dominance
Evolution of Capability EnterpriseCapability Manual Multiple Dashboards Manually developed data Limited to Excel & PowerPoint Data obtained from multiple supporting systems with no defined business rules • Portal access; improved integration with operational data and multiple end users • Leadership • Managers/Action Officers • Customers/Partners Web-based capabilities Time shifted from data gathering to data analysis Improved consistency, access, and timeliness Limited interoperability DISA’s capabilities have matured over time. Advances in technology, evolution in thought, and external drivers fuel the need & ability for continuous improvement. 25 3 3
Future DISA Business Systems Environment Customers Directory Services Order Entry/Order Mgt Service Catalog ePortal Services Budget to Report Budget Formulation Mission Partners Data Integration Employees Communication Services i Workplace Order to Fulfill DISA OSS Cost Accounting DAI Security Services Collaboration Time and Labor Procure to Pay Business Intelligence Grants Acquire to Retire DISA Enterprise Procurement System Suppliers 26 26