Download
1 / 29
290 likes | 394 Views
Data Modeling Demystified NEARC Spring 2013. Brian Hebert, Solutions Architect www.scribekey.com. Abstract and Goal.

E N D
Data Modeling DemystifiedNEARC Spring 2013 Brian Hebert, Solutions Architect www.scribekey.com www.scribekey.com
Abstract and Goal Classic relational database and object-oriented modeling diagrams, tools, and techniques are often too complicated for GIS users and project managers to fully understand. This presentation will demonstrate a simplified approach to modeling geospatial feature classes and tables, using simple attribute lists generated through data profiling. Attendees will then be able to apply this useful technique on their own data projects for either improving existing data models, or creating new ones. Goal: Provide you with a detailed but straightforward method you can use with your own projects and data. Additionally help with better understanding of classic modeling tools and techniques. www.scribekey.com
Outline • Review object oriented and relational modeling • Discuss RDB normalization • Identify a communication/skills gap • Describe refactoring • Walk through an alternative 3 step table based modeling technique • Review domains • Recap • Q & A www.scribekey.com
Data Models and Modeling • Application: Object Oriented (OO) Class Diagrams – Generate C#, Java, C++ • Relational Database: Entity-Relationship (ER) Diagrams – Generate SQL • Analysis, N-Dimensional Cube: Star, Snowflake Diagrams (generally unfamiliar to GIS practitioners) – Create Cube www.scribekey.com
Why Both OO and RDB? Geodatabase OO Code Middle Tier Presentation ArcGIS is an Object-Relational System (ORDB). Data and application metadata are stored in the backend geodatabase, loaded into middle tier, written with OO C++ code, and presented through rich GUI presentation applications, ArcMap, ArcCatalog, ArcToolBox, etc. As such, we use both OO and RDB modeling techniques. OO Databases never really made it. This class 3 tier approach is how OO data models are implemented. The current trend is to use tools like UML to design OO systems. www.scribekey.com
UML OO Diagraming UML (Unified Modeling Language) diagrams capture type hierarchies. They show type family trees, focusing on how more specific sub-classes inherit properties and behavior from more general super-classes. Becoming familiar with UML and related tools requires significant time and experience. www.scribekey.com
Designing in ArcGIS: CASE Tools or ArcCatalog ESRI CASE Tools ArcCatalog Tools Geodatabase Diagram With CASE or ArcCatalog Tools, the goal is the same, to generate a Geodatabase www.scribekey.com
RDB Entity-Relationship Diagrams and Tools Entity Relationship diagrams and related tools are typically used to create highly normalized, editing/production databases. Normalization protects referential integrity and prevents anomalies that can compromise data quality, break relationships, etc. The models we typically use in GIS are often highly de-normalized. De-normalized databases are much easier to query and use for maps and reports. www.scribekey.com
De-Normalized Data Example: Navteq If Navteq Streets data were normalized there would be multiple separate tables for street names, town names, states, zip codes, street types, etc. If this were the case, creating Geocoding or Routing applications would be MUCH more complex www.scribekey.com
SQL Query: De-Normalized and Normalized SELECT ID, NAME FROM STREETS WHERE NAME=‘Elm St’ SELECT STREETS.ID, STREET_NAMES.NAME FROM STREETS INNER JOIN STREET_NAMES ON STREETS.STREET_NAME_ID = STREET_NAMES.ID AND STREET_NAMES.NAME=‘Elm St’ Queries for normalized data are much more complex. Additionally, if data is being used in a read-only mode, there is typically no reason for highly normalized models. WARNING! In spite of this, many data RDB data modelers start a project with the assumption that the data should be highly normalized. www.scribekey.com
? Layers Attributes Symbols … UML, XSD GML ISO 19XXX, … The Tower of Babel Data Modelers ISO Standards Bodies OGC (Druids) GIS Users What do they mean? E=MC2, Abracadabra … www.scribekey.com
An Alternate Technique • Use database tables to capture/store information about feature classes, tables, attributes, and domain values. This is metadata. • Arrange lists of attributes and entities in cross reference matrices. • Use SQL queries to discover your classes, and help you create your entities. GIS users are typically very familiar with data in tables. There is no immediate need to learn an unfamiliar or complex diagraming technique to do what you need to do. This helps involves the people that know the most about the data in the modeling process. www.scribekey.com
Scenario • A university has asked us to integrate existing tabular data describing Students, Faculty, and Staff, with GIS building layer. • They have asked for a class diagram. • They also want to create tables in ArcGIS • They want to determine who is where, when, etc. • The focus is not GIS per se, but will help us concentrate on important concepts. • Reduced attribute sets will be used. Faculty Buildings Students Staff www.scribekey.com
Attribute Lists From an initial view of the 3 entity attributes we see that they share some common general attributes as well as having some specialized attributes of their own. www.scribekey.com
Sidebar: Refactoring • A great deal of complex OO and RDB data modeling is carried out in data-free environments, assuming a blank slate to start with. • In reality, this is rarely the case, and we typically have to fit existing data into our models. • As such, it is typically helpful to use a data-driven approach to modeling, where the focus is on changing existing entities, rather than creating new ones. • This is related to a technique called REFACTORING. www.scribekey.com
Creating Entity and Attribute Metadata Tables Step 1 is to capture Attribute Lists for each of the Entities in your model. If the model is based on existing data, this can be done with a data profiling tool. Otherwise, it can be done manually. Here Attribute information including Entity, Data Type, Length, Uniqueness, and FGDC XML Metadata definitions have been captured with a data profiler in MS Access. www.scribekey.com
Standardize Raw Data Attribute Names • Mapping original raw attribute names to standardized sets is a key part of refactoring. • This helps determine the unique list of attributes found across all entities, and is required for this technique to work. www.scribekey.com
Step 1: Standardized Entity Attribute List What’s in a name? How we name entities, attribute, and domain values is very important for easy-to-use, self describing data models. One important rule of thumb: An attribute meaning the same thing should have the same name, data type, length, and domain, in all the entities it appears in. In general, it is best to pick very commonly used and understood words vs. trying to be consistent. When choosing names and terms it can be helpful to see which ones are the most commonly used by getting word counts with Google. For example, Google returns 105 million hits when searching for ‘lon/lat’ and 23.8 million when searching for ‘lat/lon’ indicating ‘lon/lat’ is a far more common term. www.scribekey.com
Step 2: Create an Attribute Entity Matrix Pivot the initial list of Entities and Attribute, create a unique list of attributes and pivot the Entities to create a matrix. Note some attributes which actually use the same domain might have different names, so choose a single name for these, e.g., Major and Department become Department, Dormitory and Building use Building This can be done with SQL and/or other tools. Use TEXT data types for entity flags and PATTERN UPDATE ATT_ENT_MATRIX SET GROUP = STUDENTS & FACULTY & STAFF www.scribekey.com
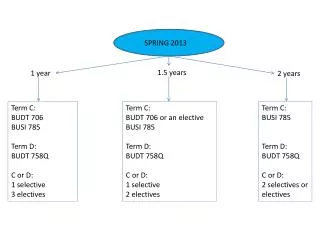
Step 3: Get Distinct Attribute Groups Sort Attributes by Group. A supplemental, and sometimes challenging, step is to name the Groups. Here we have 6 distinct sets of Attributes. Each Entity uses a set of groups. These equate to classes in OO design. Each feature class we create will contain all of the Attribute Groups it uses. www.scribekey.com
Class Diagram from Attribute Groups We see the same information we created using Attribute Groups here as a classic OO type hierarchy. Note that Faculty inherits from both Education and Worker. Instead of using inheritance trees it is sometimes easier to use the concept of interfaces. Note with C# and Java, multiple inheritance is not allowed, as it is with C++. Note also that the classes are divided into 2 types, abstract which will never actually be created, and concrete, which inherit from the abstract classes, but only show specific attributes. Note this diagram does not show relationships between entities. www.scribekey.com
Attribute Sets and Interfaces STU FAC Another way to look at the Attribute Groups is as overlapping sets. Note out of a possible 7 groups, we ended up with a total of 6. This is because there were no attributes used only by Students and Staff, shown in the area labeled 6 above. These overlapping areas are equivalent to the class interfaces. 1 2 4 STF 7 6 5 3 www.scribekey.com
The Resulting Tables Simply listing the attributes for each entity provides one of the easiest to understand and useful views. The tables holding the entity and attribute information in the metadata database can be used by relatively simple application to generate the tables. So, why is it so important to know what attribute groups different entities share? www.scribekey.com
SQL Union Views If you know what attribute groups different entities have in common, you can construct views in relational databases, using the UNION clause, to see different things as the same type of things. SELECT NAME, ‘STUDENT’ AS TYPE, BUILDING FROM STUDENTS UNION SELECT NAME, ‘FACULTY’ AS TYPE, BUILDING FROM FACULTY UNION SELECT NAME, ‘STAFF’ AS TYPE, BUILDING FROM STAFF You could then add the UNION view to ArcMap and relate it to the buildings polygon layer, to help see all the people in a single building. You could do this with any of the attribute sets (classes) the entities have in common, e.g., Worker. Union of 3 Different Tables 1 Resulting View with Same Data www.scribekey.com
Capturing Relationships • Describing relationships between entities is an important part of data modeling • Again, it can be useful to capture this information in metadata tables and matrices. Geodatabase Relationships captured by data profiling tool, in MS Access, showing ORIGIN, DESTINATION, and CARDINALITY Easy to construct entity relations matrix www.scribekey.com
A Word about Domains • Explicitly specifying the set of values that can be used for an attribute is an important part of data modeling. • Even if you are not building a normalized data model, it is still useful to capture domains; this information can be used for both data validation and application GUI construction. • This information can also be stored in the metadata repository database as well. • Here are 3 methods for this: • Lookup Tables: Valid list of values, e.g., Departments • Regular Expressions: allowed patterns, e.g., MM/DD/YYYY • SQL Expressions: Flexible assertion, e.g., range, match to another attribute, etc. www.scribekey.com
Domains as Lookup Tables Even if you are not doing full normalization, it’s important to capture domain values in tables. These can then be used to validate data and help build GUI front end pick lists. Note an empty database, with no features or rows, still has domain tables. www.scribekey.com
Recap • Consider a simple, table-centric, systematic and mechanical approach to data modeling. • You can use a table/matrix approach to modeling your entities (feature classes and tables) as collections of attribute sets, with some attribute sets common to multiple entities. You can capture relationships this way too. • You can easily capture this information in a metadata database, then use querying and sorting to help you with your task. • The resulting attribute sets will match a class inheritance and/or an class interface diagram. • When you know what attribute sets are common to multiple entities, you can use UNION views to query on the common elements. • Don’t automatically start creating a normalized set of entities if your database is to support querying, reports, and map making. • Even if you aren’t normalizing, it’s still useful to store domains in your metadata database as lookup tables, regular expressions, and SQL Statements. www.scribekey.com
Thank You – Q&A Brian Hebert www.scribekey.com www.scribekey.com