Download
1 / 24
240 likes | 396 Views
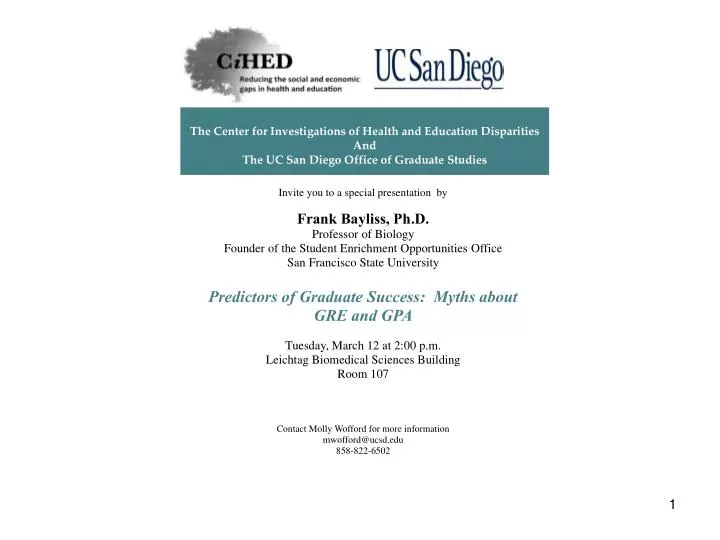
About Frank T . Bayliss , Ph.D. B.S. from Long Beach State University Ph.D. from UC Davis Currently Professor of Biology at San Francisco State University Director, Student Enrichment Opportunities Office, College of Science & Engineering, San Francisco State University Awards

E N D
About Frank T. Bayliss, Ph.D. B.S. from Long Beach State University Ph.D. from UC Davis Currently Professor of Biology at San Francisco State University Director, Student Enrichment Opportunities Office, College of Science & Engineering, San Francisco State University Awards 2003 Andreoli Award: Productive Research/Teaching Excellence. CSU Education/Research in Biotechnology. 2009 SACNAS Distinguished Undergraduate Institution Mentor Award 2010 SFSU Presidential Distinguished Faculty Service Award, 2010 Commencement
2009 Presidential Award for Excellence in Science, Mathematics and Engineering Mentoring (PAESMEM/NSF).
NATIONAL Ten-Year Completion Rates by Field & Race/Ethnicity for PhD Students Starting in 1992-4 Source: Reported in Scott Jaschik, “PhD Completion Gaps,” Inside Higher Ed. Sept 9, 2008 CGS, Ph.D. Completion Project, 2008
UC Doctoral Degree STEM Fields Completion Rates after Ten Years, by Students' US Undergraduate School1Fall 1992, '93, '94 Doctoral Entry Cohorts LifeSciences - (Biology/Biochemistry) Majority Majority + URM URM 72 95 256 360 491 672 11 17 33 44 42 61 83 112 289 404 531 733 71% 76% 73% 60% 65% 75% 69% 74% 73% 72% 58% 54% SOURCE: UCOP Graduate Longitudinal Data System data, as revised following consultation with graduate divisions. 1. Doctoral degree completion is measured by the award of a degree by the summer of the 10th year after entry. 2. Includes all STEM fields, but excludes all other programs. 3. KamranNayeri, Academic Planning & Budget, UCOP.
UC Doctoral Degree STEM Fields Completion Rates after Ten Years, by Students' US Undergraduate School1Fall 1992, '93, '94 Doctoral Entry Cohorts Physical Sciences - (Math, Chemistry & Physics) Majority URM Majority + URM 48 107 157 286 490 754 10 25 15 32 28 57 58 132 172 318 518 811 45% *45% *55% *65% 40% 47% 49% *43% *55% *64% 49% 52% *Statistically Significant p = 0.0001 SOURCE: UCOP Graduate Longitudinal Data System data, as revised following consultation with graduate divisions. 1. Doctoral degree completion is measured by the award of a degree by the summer of the 10th year after entry. 2. Includes all STEM fields but excludes all other programs. 3. KamranNayeri, Academic Planning & Budget, UCOP.
UC Doctoral Degree STEM Fields Completion Rates after Ten Years, by Students' US Undergraduate School1Fall 1992, '93, '94 Doctoral Entry Cohorts Engineering & Computer Science Majority Majority + URM URM 23 61 116 264 301 568 320 618 122 287 28 76 6 23 19 50 5 15 *52% *53% 60% 52% 57% *44% 33% 38% *37% *42% *38% 26% *Statistically Significant p = 0.0001 SOURCE: UCOP Graduate Longitudinal Data System data, as revised following consultation with graduate divisions. 1. Doctoral degree completion is measured by the award of a degree by the summer of the 10th year after entry. 2. Includes all STEM fields, but excludes all other programs. 3. KamranNayeri, Academic Planning & Budget, UCOP.
Essential Criteria for Admission Committees • Grades - Pattern of Performance & Indicator Courses • Preparation in Subject (Course Selection and Rigor) • Standardized Test Scores in Discipline (GRE Subject & ACS) • Evidence of Prior Research Experience • Nature of Involvement (Tech versus Engaged Researcher) • Ability to Discuss Past Research Projects (and Newly Described) • Letters - Analytical and Substantial • Ask Referees with First-Hand Experience and Information • Interview • Follow Recommendation of ETS and DO NOT EXCLUDEapplicants based on poor GRE scores alone (See “Data View” Handout)
“GRE Data Views” (From ETS) The graduate admissions process is frequently characterized by tight schedules and insufficient staffing. In order to expedite the process, some graduate programs and departments set an arbitrary cut point for GRE General Test scores. Applicants whose scores fall below this cut point are given little or no consideration in the admissions process. “The following graphs illustrate why it isINADVISABLEto routinely disregard applicants whose combined verbal and quantitative scores fall below 1000.” • “GRE scoresshould never be used as the sole criterion by which applicants to graduate programs are denied admission.”
ETS – DataView • Percent Below 1000 • 86% of African Americans 76% of Puerto Ricans • 69% of Mexican Americans 61% of American Indian and Hispanic • 48% US Citizens 39% Non-US Citizens
Percent Below a score of 1000 in GRE test 86% of African Americans 76% of Puerto Ricans 69% of Mexican Americans 61% of American Indian and Hispanic 48% US Citizens 39% Non-US Citizens 35 % Male 55 % Female Ethnic/Racial and Gender Differences
ETS DataView • Total, Citizenship and Gender Groups • 46% of total GRE examinees fell below 1000. • 39% of non-US citizens and 48% of US citizens fell below 1000. • 55%of females and 35%males had a combined score of less than 1000. 13
Differential Impact of Curriculum On Aptitude Test Scores Comparison of SAT & GRE
Table I. Angoff & Johnson William H. Angoff and Eugene G. Johnson, "The Differential Impact of Curriculum on Aptitude Test Scores," 27 J. Ed. Meas. 291, 293 (Table1) (1990).
Teachers College RecordGrading in American Colleges and UniversitiesStuart Rojstaczor & ChristipherHoaly – March 04, 2010 • The mean GPA of a school is highly dependent on the average quality of its student body and whether it is public or private. • Relative to other schools, public-commuter and engineering schools grade harshly. • These trends may help explain why private school students are disproportionately represented in PhD study in science and engineering and why they tend to dominate admission into prestigious professional schools.
Selected GPA for Sample CSU and UC Campuses http://www.gradeinflation.com/
Selected GPA for sample Private Universities http://www.gradeinflation.com/
What Can Be Done to Increase the Number of URM in Science PhD Degree Programs? Modify Review Criteria Omit General GRE Target Non-Traditional Sources Masters Degree Programs Post-Baccalaureate Programs Partner with Minority Institution(s) Co-Train students at Research I Institutions Develop Faculty Buy-in of Joint Program/Students Admit Students with Promise Refer Less-Competitive PhD Applicants to CSU Campuses
Student with Promise From an SFSU faculty colleague: “The student has great promise -- his lab advisor at UCB says he's been essentially functioning as a PhD student; his GREs are through the roof (97%ile verbal, 92 analytical). I don't know what his deal in college was.” From the student with a 2.54 GPA: “A short background on me: I finished my undergrad at UCSC in 2008 with a very low GPA; at the time, I hadn't considered graduate school as a future option. I worked at a biotech company for a couple of years but grew restless and bored with the monotony and decided to try for academia. Through a number of meetings with faculty at UC Berkeley, I started as a staff researcher in a neurobiology lab under Dr. Frank Werblin, with the eventual goal of entering into a PhD program at Cal. Unfortunately, after a year-and-a-half of time in his lab, our funding ran out, and he retired, which largely curtailed my push for entry into the program (he was hoping to partially fund my application).”
Partnerships with“Farm Clubs” • Consider developing partnerships with minority institutions (UG & Masters) • Relationships will likely require “investment” of time/leadership • Consider established programs: • Post-Baccalaureate (PREP) Programs (see web site) • MA-MS/PhD Bridge Programs (see web site) • MA-MS/PhD RISE Programs (http://www.nigms.nih.gov/funding/rise.html) • NIH-IMSD Programs (http://www.nigms.nih.gov/funding/imsd.html) • Sponsor UG & Masters student research at DOCTORAL campuses • Provide faculty seminar speakers to “partner” institutions with full-day activities • Invite faculty from partner institutions to train/collaborate with doctoral campus faculty during summers and leaves • Offer seminars/courses at “partner” institution in areas of need • Co-write grant proposals to improve research environment/student training • Agree to review all graduate applicants from partner institution